Sahanka Macaamiisha iyo Bulshada
Natiijooyinka, Waxyaabaha Muhiimka ah ee Laga Qaadanayo, iyo Waxyaabaha Ugu Muhiimsan
RTD, la xiriirka macaamiisheenna iyo bulshooyinka aan u adeegno waxay noo ogolaanaysaa inaan si fiican u fahanno baahiyaha, filashooyinka, iyo khibradaha. Mid ka mid ah siyaabaha aan ula xiriirno macaamiisheenna iyo bulshada waa iyadoo la sameeyo sahanno sannadle ah si loo cabbiro waxqabadka hay'adaha.
2025 Sahanka Sare ee Macaamiisha iyo Sahanka Qiimaha Bulshada Waxay na siisaa aragtiyo ku saabsan waxa si fiican u shaqeynaya iyo meelaha loo baahan karo horumarin dheeraad ah. Si taxaddar leh u eegista xogtan waxay noo ogolaaneysaa inaan aqoonsanno isbeddellada, wax ka qabanno walaacyada, iyo inaan horumarinno hawlaha iyo adeegyada si xog ogaal ah. Hawshani ma aha oo kaliya inay RTD ka caawiso inay wanaajiso hufnaanta iyo qanacsanaanta macaamiisha, laakiin waxay kobcisaa kalsoonida iyo hufnaanta iyadoo la muujinayo ballanqaad dhegeysi iyo horumarin joogto ah. Si aad wax badan uga akhrido natiijooyinka sahanka, Booqo bogga joojinta wararka ee RTD.
Boggan:

Dulmar guud oo ku saabsan Sahaminta
Sannadkii shanaad oo xiriir ah, RTD waxay sahamisay macaamiisheeda iyo bulshada si ay si fiican u fahmaan awoodaha hay'adda, iyo sidoo kale inay aqoonsadaan fursadaha lagu horumarin karo.
RTD mar kale ayaa heshiis la gashay Machadka ETC, oo ah shirkad cilmi-baaris oo heer qaran ah oo dhinac saddexaad ah, si ay u sameyso sahannadeeda sanadlaha ah sanadka 2025. Machadka ETC wuxuu ku takhasusay bulshada, gaadiidka, badbaadada dadweynaha, iyo noocyada kale ee sahannada dibadda ee hay'adaha dowladda, ururada aan faa'iido doonka ahayn, iyo kuwa adeegga dadweynaha. Machadka ETC wuxuu sameeyay in ka badan 3.2 milyan oo sahan ah 1,000 bulshooyin, isagoo dejiyay heerka xogta iyo halbeegga qaranka.
Tobanaan sano oo waayo-aragnimo ah oo shirkadda cilmi-baarista samaysay waxay ka caawisaa dawladaha hoose iyo hay'adaha dowliga ah inay si fiican u fahmaan dareenka dadweynaha iyada oo loo marayo sahanno ay khabiiradu qorsheeyeen, falanqayn xog oo xooggan, iyo warbixinno qoto dheer.
Habka iyo Kala-fogaanshaha
Dhageystayaasha, Muddada Ururinta, iyo Habka Sahanka
Bishii Abriil 2025, afar sahan oo kala duwan oo tirakoob ahaan sax ah ayaa la sameeyay si loo fahmo aragtida, dabeecadaha, khibradaha, iyo ra'yiga macaamiisheeda iyo bulshada.
| Sahamin | Dhageystayaasha | Muddada Ururinta | Habka | Sahamin la dhammeeyay | Kalsoonida Mudada |
|---|---|---|---|---|---|
| Qiimaha Bulshada | Qoysaska aagga magaalooyinka, oo u dhigma dadka deegaanka | Abriil 2025 | Boostada, emaylka, iyo qoraalka | 770 | +/- 3.8% heerka kalsoonida 95% |
| Macaamiisha ugu Fiican: Bas | Dhammaan waddooyinka basaska, oo u dhigma fuulitaanka guga 2025 | Abriil 2025 | Faragelinta macaamiisha | 1,063 | +/- 2.8% heerka kalsoonida 95% |
| Macaamiisha ugu Fiican: Tareenka | Dhammaan khadadka tareenada, oo u dhigma kuwa loo raaco guga 2025 | Abriil 2025 | Faragelinta macaamiisha | 758 | +/- 2.8% heerka kalsoonida 95% |
| Macaamiisha ugu Fiican: Paratransit | Macaamiisha paratransit-ka ee diiwaangashan | Abriil 2025 | Boostada, emaylka, iyo qoraalka | 444 | +/- 4.9% heerka kalsoonida 95% |
Habka Ka-joojinta Macaamiisha
Sahaminta basaska iyo tareenada waxaa lagu sameeyay iyadoo la adeegsanayo Habka faragelinta macaamiisha, taas oo u saamaxday cilmi-baarayaasha inay soo ururiyaan jawaab celin degdeg ah oo waqtiga-dhabta ah oo ka timaadda shakhsiyaadka isticmaalaya adeegyada RTD. Habkan sahanka wuxuu hubinayaa in jawaab celinta ay bixiyaan macaamiisha dhabta ah, xogta la ururiyayna ay u dhigantaa waddooyinka basaska gaarka ah, khadadka tareenka, iyo adeegyada gaadiidka.
Kalsoonida Mudada
The kalsoonida muddada dheer waxay muujinaysaa baaxadda ay jawaabaha dhabta ah ee dadweynaha oo dhan u badan tahay inay hoos u dhacaan, iyadoo lagu saleynayo xogta sahanka. Sahannada RTD waxaa lagu muujiyay heer kalsooni 95% ah, taasoo la macno ah in haddii sahan sax ah oo isku mid ah la sameeyo 100 jeer, natiijooyinku ay ku dhici doonaan xadkaas 95 jeer. Tani waxay gacan ka geysaneysaa hubinta in natiijooyinka sahanka ay yihiin kuwo tirakoob ahaan sax ah oo matalaya dhammaan macaamiisha iyo bulshada.
Xogta isbarbardhigga qaranka ee Machadka ETC waxaa laga soo ururiyay sahaminta guryaha ee laga sameeyay boqolaal magaalo oo dalka oo dhan ah.
Waxyaabaha Muhiimka ah iyo Waxyaabaha Muhiimka ah
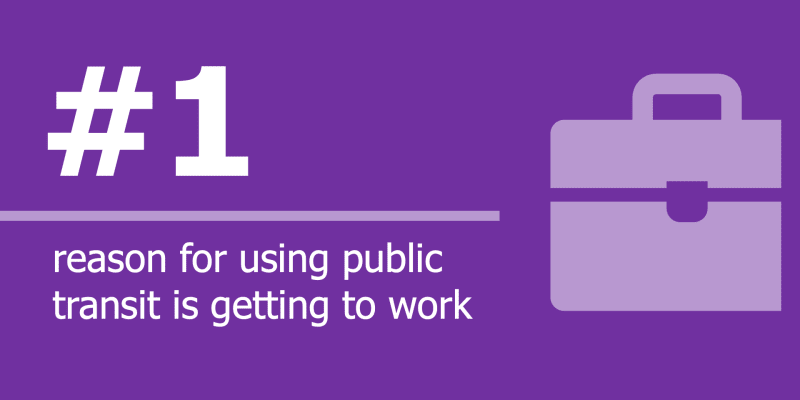 Isticmaalka GaadiidkaHelitaanka shaqada waa sababta ugu weyn ee dadku u isticmaalaan adeegyada basaska iyo tareenada RTD, taasoo kor u kacday 7% laga bilaabo 2024.
 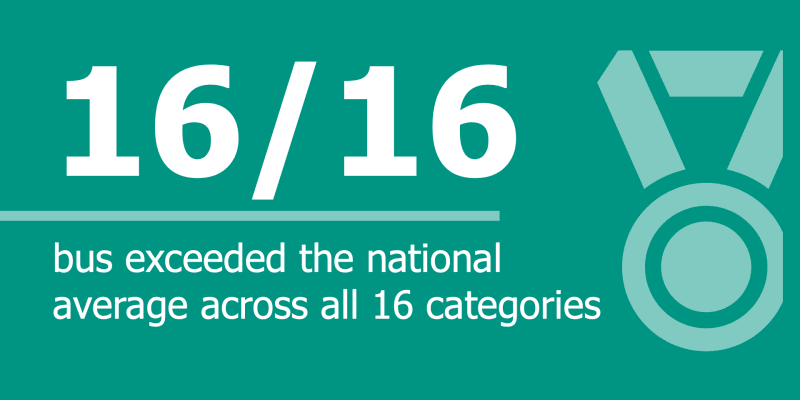 Baska: Celceliska QarankaBasku wuxuu dhaafay celceliska qaranka dhammaan 16-ka qaybood ee sahanka
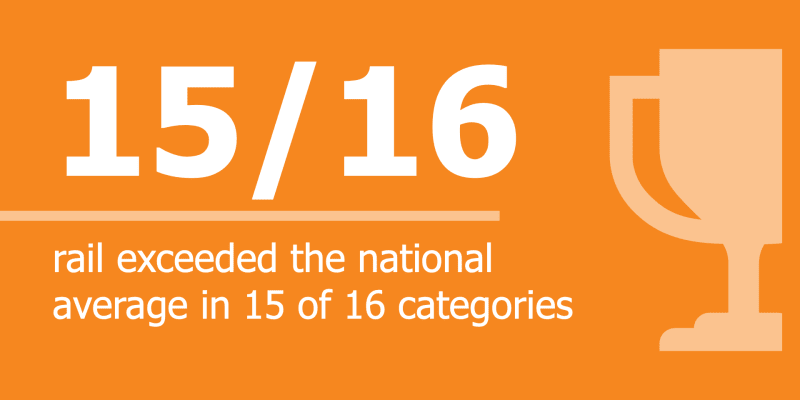 Tareenka: Celceliska QarankaTareenka tareenku wuxuu dhaafay celceliska qaranka ee 15 ka mid ah 16-ka qaybood ee sahanka
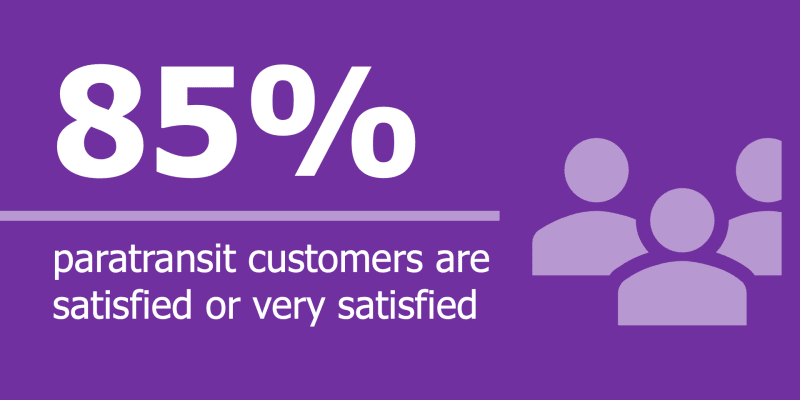 Paratransit: Qanacsanaanta Guud85% macaamiisha paratransit-ka ayaa ku qanacsan ama aad ugu qanacsan adeegyada RTD.
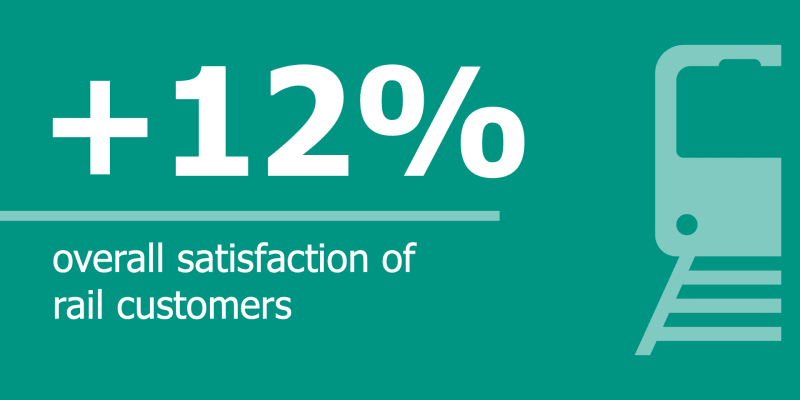 Tareenka: Qanacsanaanta Guud12% koror sanadba sanadka ka dambeeya ah oo ku yimid qanacsanaanta guud ee macaamiisha tareenada
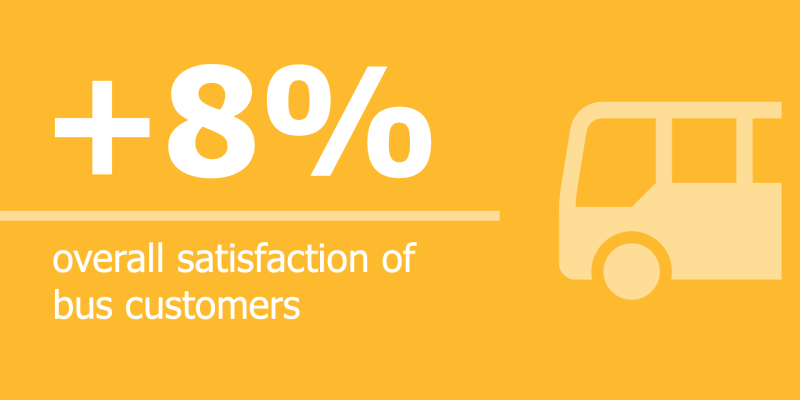 Bas: Qanacsanaanta Guud8% koror sanadba sanadka ka dambeeya ah oo ku yimid qanacsanaanta guud ee macaamiisha basaska
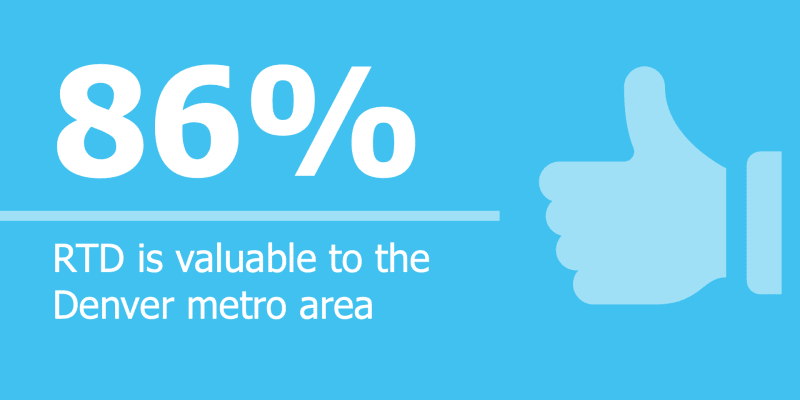 Bulsho: Qiimaha RTD86% bulshada waxay aaminsan yihiin in RTD ay qiimo u leedahay aagga tareenka dhulka hoostiisa mara ee Denver.
 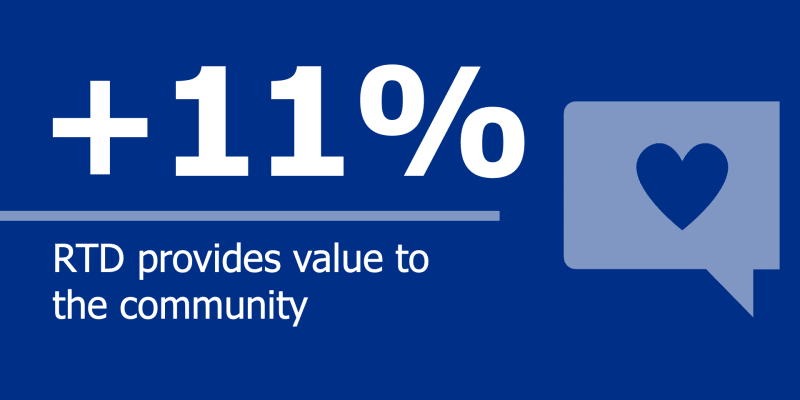 Bulsho: Qiimaha RTD11% koror sanadba sanadka ka dambeeya bulshada ah oo muujinaya in RTD ay bixiso qiimo
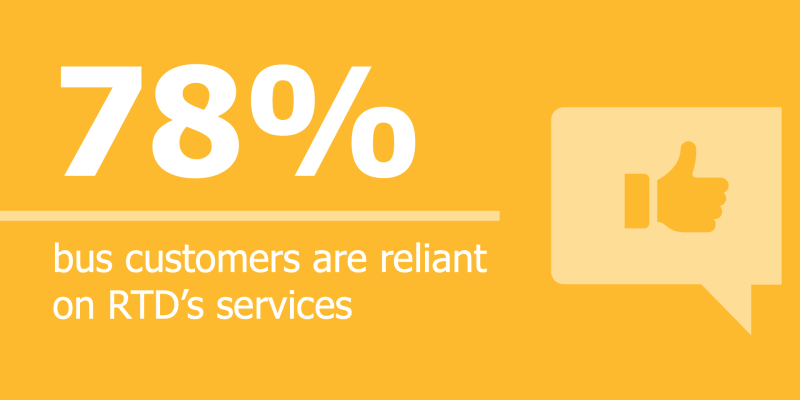 Baska: Astaamaha Macaamiisha78% macaamiisha basaska waxay ku tiirsan yihiin adeegyada RTD
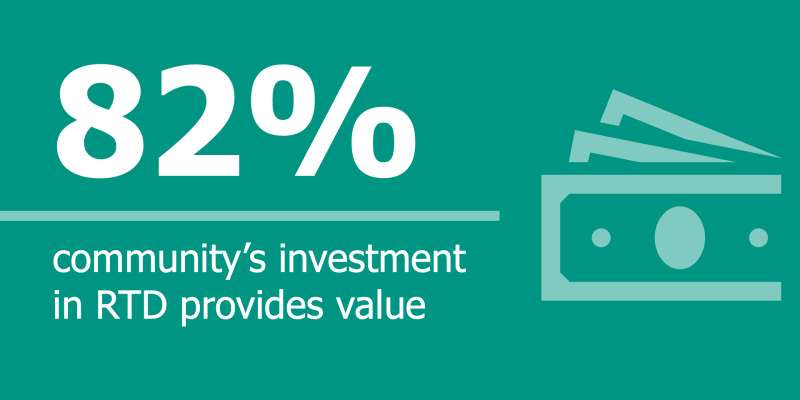 Bulsho: Qiimaha RTD82% bulshada waxay aaminsan yihiin in maalgashigooda RTD uu qiimo bixiyo
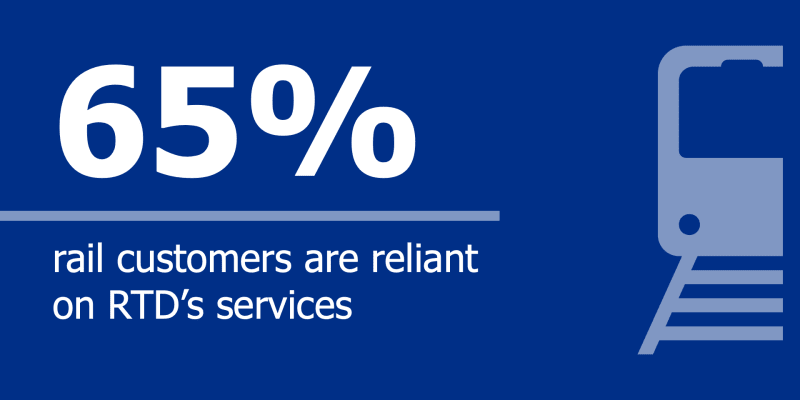 Tareenka: Astaamaha Macaamiisha65% macaamiisha tareenada waxay ku tiirsan yihiin adeegyada RTD
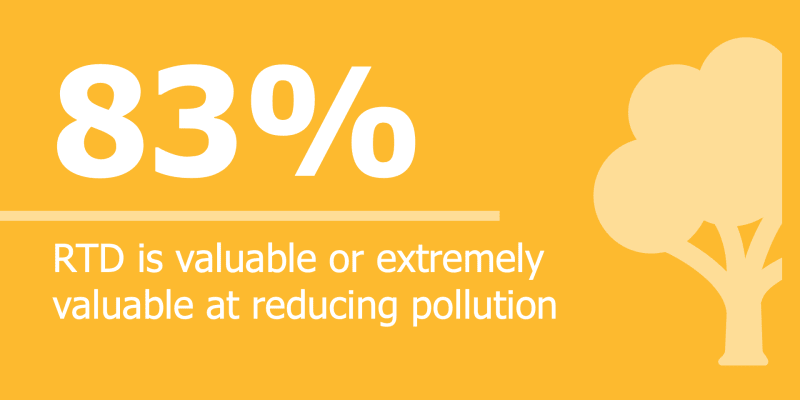 Bulshada: Yaraynta Wasakhowga83% bulshada waxay aaminsan yihiin in RTD ay qiimo leedahay ama aad u qiimo badan tahay marka la yareynayo wasakhowga iyo gaaritaanka dhaqamada waara.
| 2025 | 2024 | 2023 | Isbarbardhigga 2025 iyo 2024 | |
|---|---|---|---|---|
| Shaqada | 41% | 34% | 27% | +7% |
| Madadaalo, bulsho, ama madadaalo | 35% | 42% | 54% | -7% |
| Dugsiga | 6% | 4% | 5% | + 2% |
| Dukaamaysiga, raashinka, ama shaqooyinka | 9% | 7% | 4% | + 2% |
| Caafimaad | 5% | 4% | 2% | +1% |
| Hawlaha Diinta | 0% | 1% | 1% | -1% |
| Kale | 6% | 9% | 7% | -3% |

Sahaminta Sare ee Macaamiisha
Saddex sahan oo macaamiisha la xiriira ayaa la sameeyay si loo qiimeeyo waxqabadka RTD ee la xiriira heerka sare ee macaamiisha, mid ka mid ah afarta hay'adood ee la ansixiyay. Mudnaanta Istaraatiijiyadeed. Sahamin kasta si gaar ah ayuu diiradda u saaray macaamiisha basaska, tareenada, iyo kuwa rakaabka qaada, sahaminta basaska iyo tareenadana waxaa lagu sameeyay hab lagu joojiyo gaadiidka. Qorshaha muunad qaadista wuxuu ka koobnaa aagga adeegga oo dhan wuxuuna ku jiray dhammaan waddooyinka basaska iyo khadadka tareenada, iyo sidoo kale macaamiisha rakaabka qaada ee diiwaangashan.
Dhibcaha Dallacaadda Saafiga ah
Guudmarka NPS
Halbeeg muhiim ah oo ay bixiso sahaminta macaamiisha iyo bulshada ee RTD waa Dhibcaha Dhiirrigelinta Shabakadda (NPS). NPS waxay cabbirtaa sida ay dadku ugu badan tahay inay kula taliyaan adeegyada RTD qof kale, iyadoo lagu saleynayo miisaan u dhexeeya -100 ilaa +100.
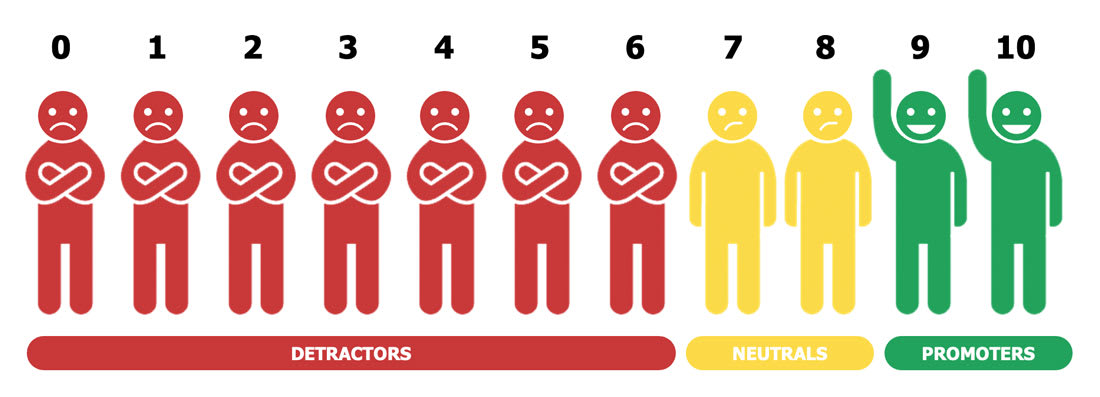
Jawaabaha sahanka waxaa loo qaybiyaa saddex qaybood:
- Dhiirrigeliyayaal (9–10)
- Dad aan firfircoonayn (7–8)
- Qalabka wax ka gooya (0–6)
Xisaabinta NPS-ka
Dhibcaha waxaa lagu xisaabiyaa iyadoo laga jarayo boqolleyda Detractors-ka boqolleyda Promoters-ka, taasoo siinaysa dareen qanacsanaan guud, daacadnimo, iyo rabitaan lagu talinayo adeegyada RTD.

- -100 ilaa 0: Waxay u baahan yihiin horumarin
- 0 ilaa 20: Wanaagsan
- 21 ilaa 50: Ku habboon
- 51 ilaa 80: Aad u fiican
- 81 ilaa 100: Heerka Adduunka
Dhibcaha Dallacaadda Saafiga ah
Macaamiisha Basaska, Tareenka, iyo Paratransit ee Isku-dhafan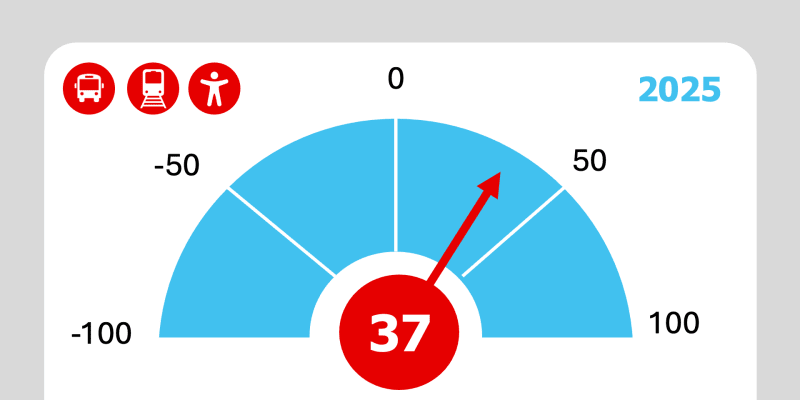 2025Dhibcaha NPS ee Isku-dhafka ah: +37
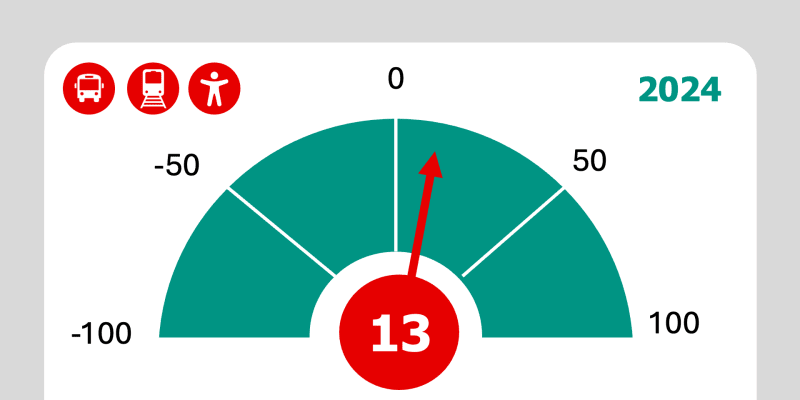 2024Dhibcaha NPS ee Isku-dhafka ah: +13
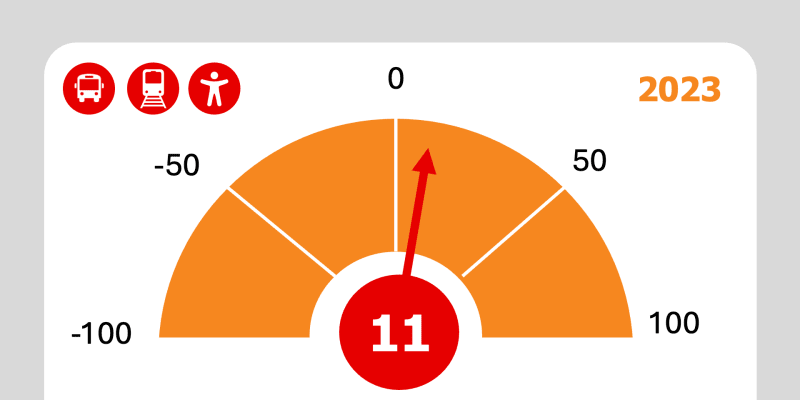 2023Dhibcaha NPS ee Wadajirka ah: +11
Bas: Natiijooyinka Sahanka
Dhibcaha Dhiirrigeliyaha Shabakadda Macaamiisha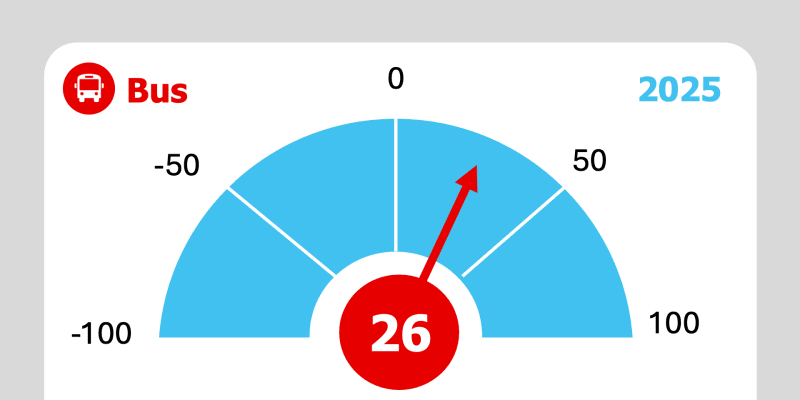 2025Dhibcaha Baska NPS: +26
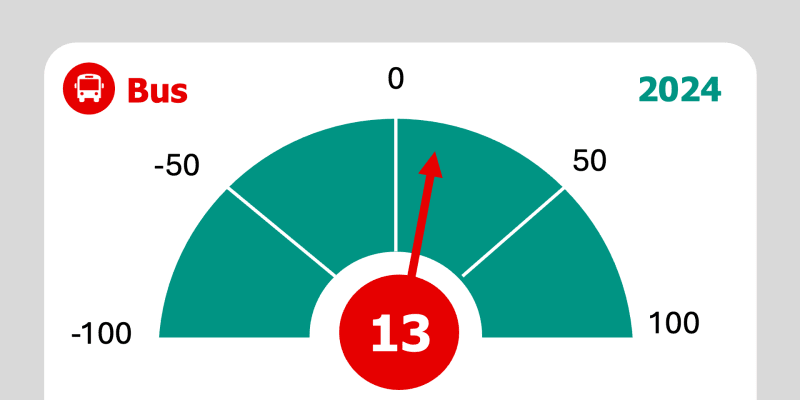 2024Dhibcaha NPS ee Baska: +13
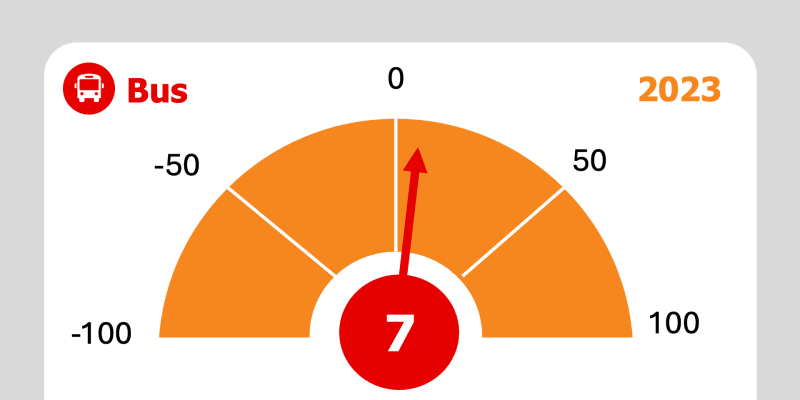 2023Dhibcaha Baska NPS: +7
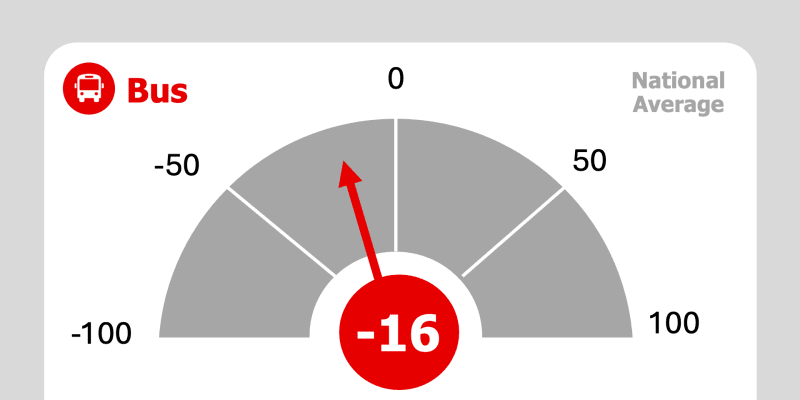 Celceliska QarankaDhibcaha Baska NPS: -16
Baska: Waxyaabaha Muhiimka ah ee la Qaadanayo iyo Waxyaabaha ugu Muhiimsan
Baska: Celceliska QarankaBasku wuxuu dhaafay celceliska qaranka dhammaan 16-ka qaybood ee sahanka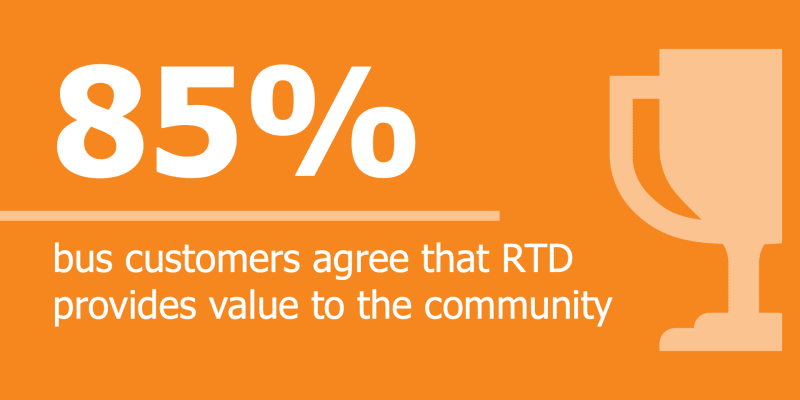 Baska: Qiimaha RTD85% macaamiisha basaska ayaa isku raacsan in RTD ay qiimo u siiso bulshada
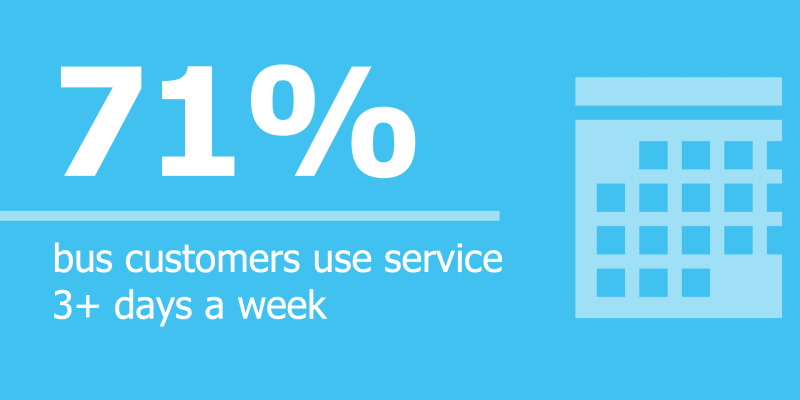 Baska: Astaamaha Macaamiisha71% macaamiisha basaska ayaa adeegsada adeegyada RTD saddex maalmood ama ka badan usbuucii.Bas: Qanacsanaanta Guud8% koror sanadba sanadka ka dambeeya ah oo ku yimid qanacsanaanta guud ee macaamiisha basaska
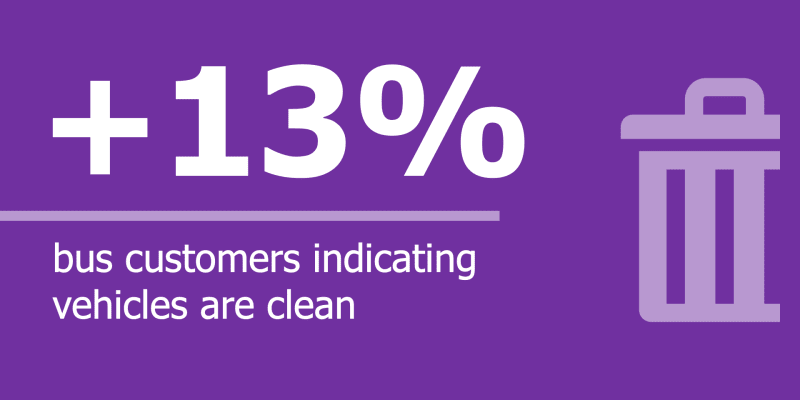 Baska: Nadaafadda Gawaarida13% koror sanadba sanadka ka dambeeya ah oo ku yimid macaamiisha basaska oo muujinaya in gawaaridu nadiif yihiin
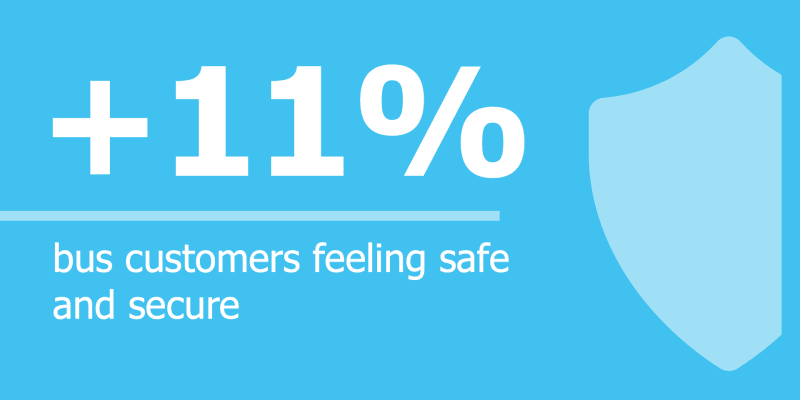 Baska: Badbaadada iyo Amniga11% koror sanadba sanadka ka dambeeya ah oo ku yimid macaamiisha basaska oo dareemaya ammaan iyo ammaan inta ay ku sugayaan joogsiga
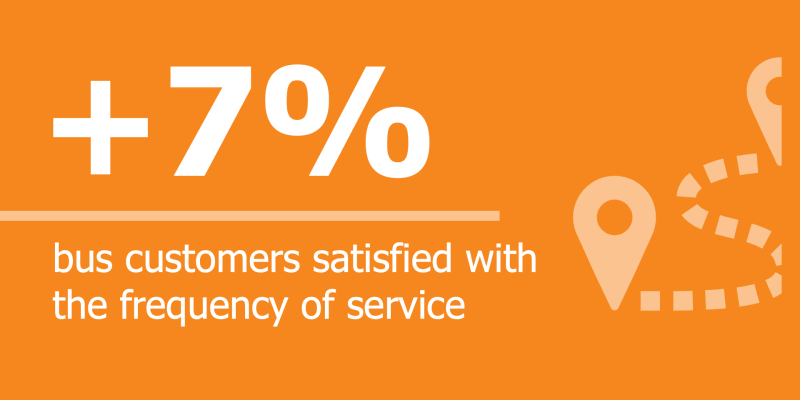 Baska: Inta jeer ee Adeegga la sameeyo7% koror sanadba sanadka ka dambeeya ah oo ku yimid macaamiisha basaska oo ku qanacsan ama aad ugu qanacsan inta jeer ee adeegga la bixiyo
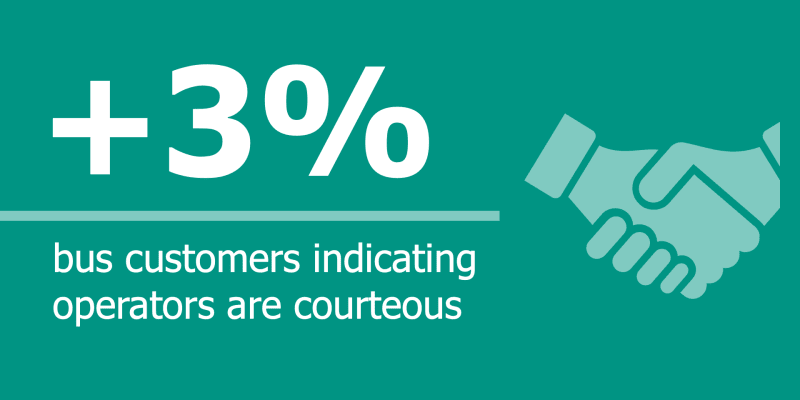 Baska: Hawl wadeennada3% koror sanadba sanadka ka dambeeya macaamiisha oo muujinaya in wadayaasha basaska ay yihiin kuwo edeb lehBaska: Astaamaha Macaamiisha78% macaamiisha basaska waxay ku tiirsan yihiin adeegyada RTD
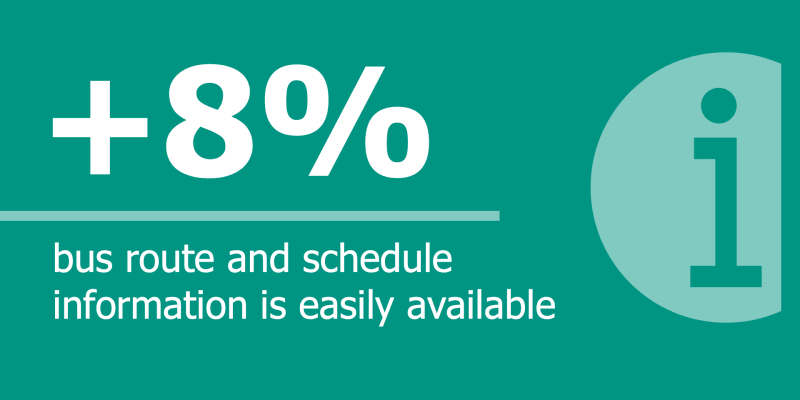 Baska: Macluumaadka8% kororka sanadlaha ah ee macaamiisha basaska ayaa muujinaya in macluumaadka wadada iyo jadwalka si fudud loo heli karo
Astaamaha Macaamiisha
Tirakoobka iyo Isticmaalka Gaadiidka
Bas
- Waxay u badan tahay inay yihiin rag iyo 18-39 sano jir
- 42% Caddaan ama Caddaan
- 21% Hispanic, Isbaanish, ama Latino/a/x
- 20% Madow/Afrikaan Ameerikaan ah
- 63% waxay sheegeen in dakhliga qoyska uu ka yar yahay $50,000
- 71% waxay isticmaalaan adeegga baska saddex maalmood ama ka badan usbuucii
- 78% waxay ku tiirsan yihiin adeegga basaska
- 52% waxay isticmaalaan basaska si ay u tagaan shaqada una soo noqdaan
Qanacsanaanta iyo Xushmadda
Bandhigga
Boqolleyda jawaab bixiyayaasha sahanka oo muujinaya inay ku raacsan yihiin (Ku raacsan yihiin ama Si xooggan u raacsan yihiin)
| Su'aal/Mowduuc | 2025 | 2024 | 2023 | Celceliska Qaranka | Isbarbardhigga 2025 iyo 2024 |
|---|---|---|---|---|---|
| Basku badanaa wuu ku shaqeeyaa waqtigii loogu talagalay | 62.2% | 56.5% | 48.7% | 48% | +5.7% |
| Basku wuxuu i geeyaa meesha aan u socdo waqti macquul ah gudaheed | 75.3% | 70.2% | 65.3% | 58% | +5.1% |
| Inta jeer ee adeeggu uu yahay mid lagu qanco | 68.0% | 61.0% | 59.9% | 54% | +7.0% |
Badbaadada Shaqsiga iyo Raaxada
Boqolleyda jawaab bixiyayaasha sahanka oo muujinaya inay ku raacsan yihiin (Ku raacsan yihiin ama Si xooggan u raacsan yihiin)
| Su'aal/Mowduuc | 2025 | 2024 | 2023 | Celceliska Qaranka | Isbarbardhigga 2025 iyo 2024 |
|---|---|---|---|---|---|
| Waxaan dareemaa ammaan iyo ammaan inta aan sugayo baska | 65.8% | 54.5% | 56.6% | 35% | +11.3% |
| Waxaan dareemaa ammaan iyo ammaan inta aan baska saaran yahay | 72.6% | 61.6% | 64.9% | 43% | +11.0% |
| Basku waa nadiif | 67.2% | 53.9% | 61.7% | 38% | +13.3% |
Helitaanka
Boqolleyda jawaab bixiyayaasha sahanka oo muujinaya inay ku raacsan yihiin (Ku raacsan yihiin ama Si xooggan u raacsan yihiin)
| Su'aal/Mowduuc | 2025 | 2024 | 2023 | Celceliska Qaranka | Isbarbardhigga 2025 iyo 2024 |
|---|---|---|---|---|---|
| Qiimaha qiimaha waa macquul | 76.4% | 71.4% | 63.9% | 60% | 5.0% |
| Joogsiyada basaska ayaa si habboon loogu meeleeyay | 75.9% | 74.1% | 66.2% | 54% | +1.8% |
Hawlgallada
Boqolleyda jawaab bixiyayaasha sahanka oo muujinaya inay ku raacsan yihiin (Ku raacsan yihiin ama Si xooggan u raacsan yihiin)
| Su'aal/Mowduuc | 2025 | 2024 | 2023 | Celceliska Qaranka | Isbarbardhigga 2025 iyo 2024 |
|---|---|---|---|---|---|
| Waxaan dareemayaa in basasku ay yihiin kuwo farsamo ahaan ammaan ah | 88.0% | 84.0% | 79.0% | Lama Helin | +4.0 |
| Basaska ayaa shaqeeya maalmaha aan u baahdo | 81.4% | 82.9% | 71.5% | Lama Helin | -1.5% |
| Basaska waxay shaqeeyaan waqtiyada aan u baahdo | 74.1% | 72.0% | 66.4% | Lama Helin | +2.1% |
Macluumaadka
Boqolleyda jawaab bixiyayaasha sahanka oo muujinaya inay ku raacsan yihiin (Ku raacsan yihiin ama Si xooggan u raacsan yihiin)
| Su'aal/Mowduuc | 2025 | 2024 | 2023 | Celceliska Qaranka | Isbarbardhigga 2025 iyo 2024 |
|---|---|---|---|---|---|
| Way fududahay in la ogaado haddii basasku ay ku shaqeynayaan jadwalka | 68.1% | 57.4% | 69.2% | 54% | +10.7% |
| Haddii RTD ay la kulanto carqalado adeeg, si ku filan ayaan ula socdaa | 57.4% | 47.7% | 63.8% | 52% | +9.7% |
| Waxaan dareemayaa in RTD ay bixisay macluumaad ku filan oo ku saabsan adeegyada ay bixiso | 82.9% | 72.5% | 80.3% | Lama Helin | 10.4% |
| Waxaan dareemayaa inaan xog ogaal u ahay isbeddellada adeegga jadwalka | 63.0% | 54.6% | 65.8% | Lama Helin | +8.4% |
| Macluumaadka ku saabsan jadwalka wadada iyo khariidadaha si fudud ayaa loo heli karaa | 81.1% | 73.1% | 75.2% | Lama Helin | +8.0% |
| Macluumaadka ku saabsan jadwalka wadada iyo khariidadaha waa sax | 76.7% | 69.8% | 72.4% | Lama Helin | +6.9% |
| Guud ahaan, agabka isgaarsiinta ee RTD iyo macluumaadka ku saabsan adeegyada iyo jadwalka waa kuwo tayo sare leh | 75.2% | 64.2% | 75.3% | Lama Helin | +11.0% |
Dhaqanka Hawl-wadeenka
Boqolleyda jawaab bixiyayaasha sahanka oo muujinaya inay ku raacsan yihiin (Ku raacsan yihiin ama Si xooggan u raacsan yihiin)
| Su'aal/Mowduuc | 2025 | 2024 | 2023 | Celceliska Qaranka | Isbarbardhigga 2025 iyo 2024 |
|---|---|---|---|---|---|
| Darawalada basaska ayaa si ammaan ah u maareeya gaariga | 82.8% | 82.5% | 70.8% | 69% | +0.3% |
| Darawalada basaska waa kuwo edeb leh | 77.4% | 74.3% | 70.3% | 61% | +3.1% |
| Darawalada basaska ayaa waxtar leh | 77.8% | 75.4% | 68.7% | 60% | +2.4% |
Adeegga Macaamiisha
Boqolleyda jawaab bixiyayaasha sahanka oo muujinaya inay ku raacsan yihiin (Ku raacsan yihiin ama Si xooggan u raacsan yihiin)
| Su'aal/Mowduuc | 2025 | 2024 | 2023 | Celceliska Qaranka | Isbarbardhigga 2025 iyo 2024 |
|---|---|---|---|---|---|
| Su'aashaydii, walaacii, ama cabashadii waa la xalliyay | 63.9% | 56.0% | 60.9% | Lama Helin | +7.9% |
| Xallinta khilaafka waxaa la gaaray waqtigii loogu talagalay | 90.0% | 91.7% | 89.4% | Lama Helin | -1.7% |
| Wakiilada adeegga macaamiisha ee RTD waa kuwo edeb leh | 74.1% | 71.7% | 62.5% | Lama Helin | +2.4% |
Meelaha loo socdo iyo Maalgelinta
Boqolleyda jawaab bixiyayaasha sahanka oo muujinaya inay ku raacsan yihiin (Ku raacsan yihiin ama Si xooggan u raacsan yihiin)
| Su'aal/Mowduuc | 2025 | 2024 | 2023 | Celceliska Qaranka | Isbarbardhigga 2025 iyo 2024 |
|---|---|---|---|---|---|
| RTD waxay bixisaa marin u helidda goobaha muhiimka ah ee adeegga dadweynaha | 83.6% | 80.2% | 74.5% | Lama Helin | +3.4% |
| Hay'adaha gaarka loo leeyahay, kuwa aan faa'iido doonka ahayn, iyo dowladaha hoose waa inay tixgeliyaan kordhinta maalgelinta si loo horumariyo tayada iyo/ama loo ballaariyo adeegyada | 82.9% | 83.2% | 76.7% | Lama Helin | -0.3% |
Qiimaha Bulshada
Boqolleyda jawaab bixiyayaasha sahanka oo muujinaya inay ku raacsan yihiin (Ku raacsan yihiin ama Si xooggan u raacsan yihiin)
| Su'aal/Mowduuc | 2025 | 2024 | 2023 | Celceliska Qaranka | Isbarbardhigga 2025 iyo 2024 |
|---|---|---|---|---|---|
| RTD waxay qiimo u siisaa bulshada | 84.6% | 84.2% | 72.7% | 67% | +0.4% |
Tareenka: Natiijooyinka Sahanka
Dhibcaha Dhiirrigeliyaha Shabakadda Macaamiisha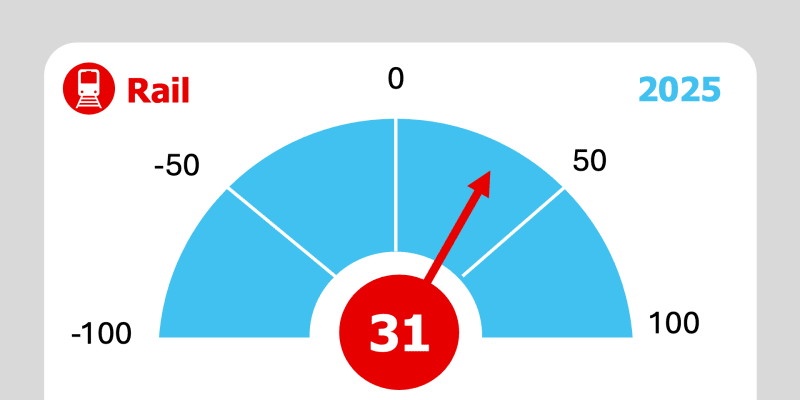 2025Dhibcaha NPS ee Tareenka: +31
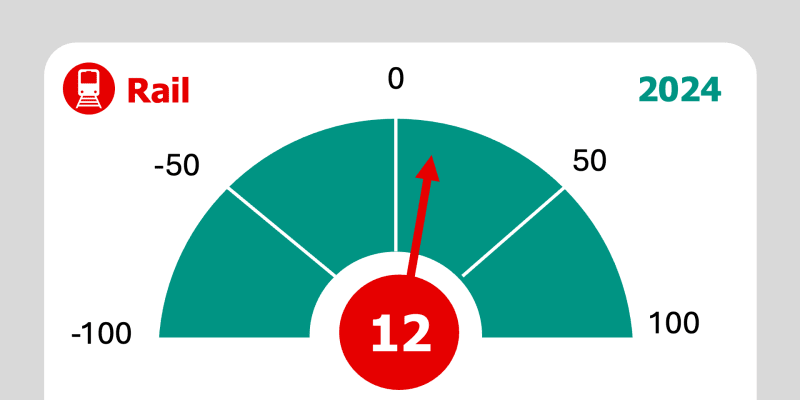 2024Dhibcaha NPS ee Tareenka: +12
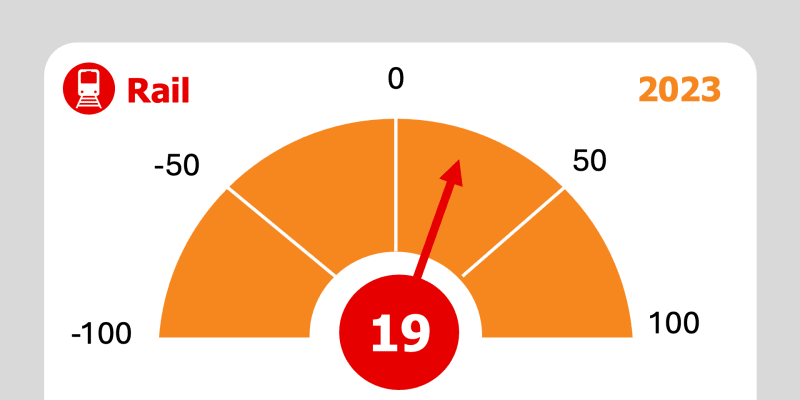 2023Dhibcaha NPS ee Tareenka: +19
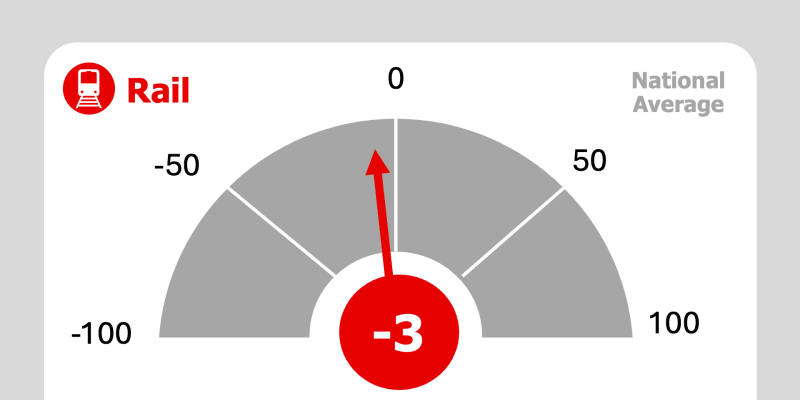 Celceliska QarankaDhibcaha NPS ee Tareenka: -3
Tareenka: Waxyaabaha Muhiimka ah iyo Waxyaabaha Ugu Muhiimsan
Tareenka: Celceliska QarankaTareenka tareenku wuxuu dhaafay celceliska qaranka ee 15 ka mid ah 16-ka qaybood ee sahankaTareenka: Astaamaha Macaamiisha65% macaamiisha tareenada waxay ku tiirsan yihiin adeegyada RTDTareenka: Qanacsanaanta Guud12% koror sanadba sanadka ka dambeeya ah oo ku yimid qanacsanaanta guud ee macaamiisha tareenada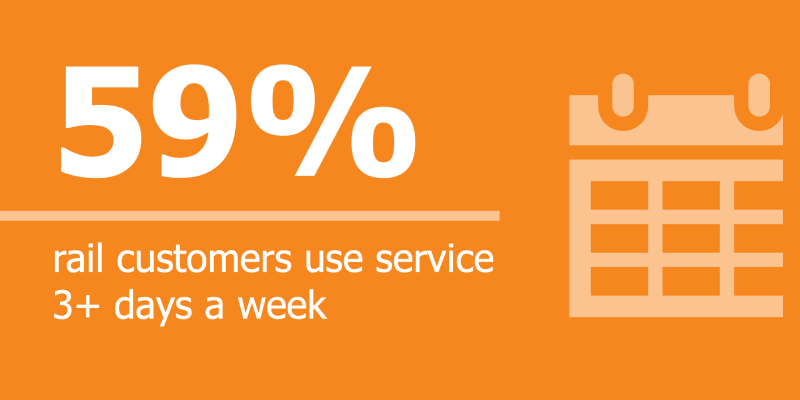 Tareenka: Astaamaha Macaamiisha59% macaamiisha tareenada ayaa adeegsada adeegyada RTD saddex maalmood ama ka badan usbuucii
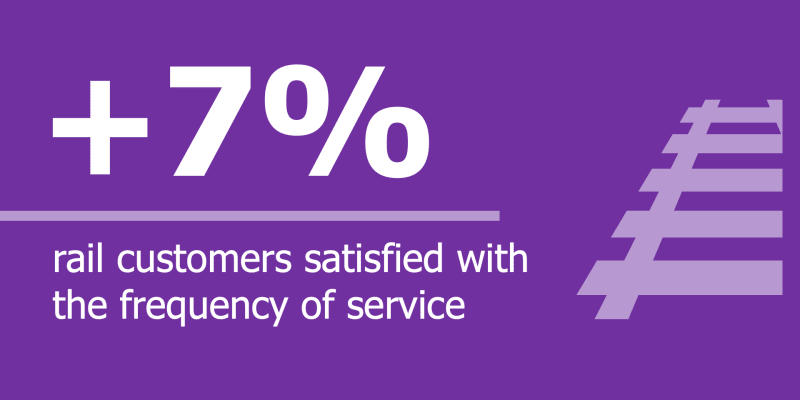 Tareenka: Inta jeer ee Adeegga7% koror sanadba sanadka ka dambeeya ah oo ku yimid macaamiisha tareenada oo ku qanacsan ama aad ugu qanacsan inta jeer ee adeegga la bixiyo
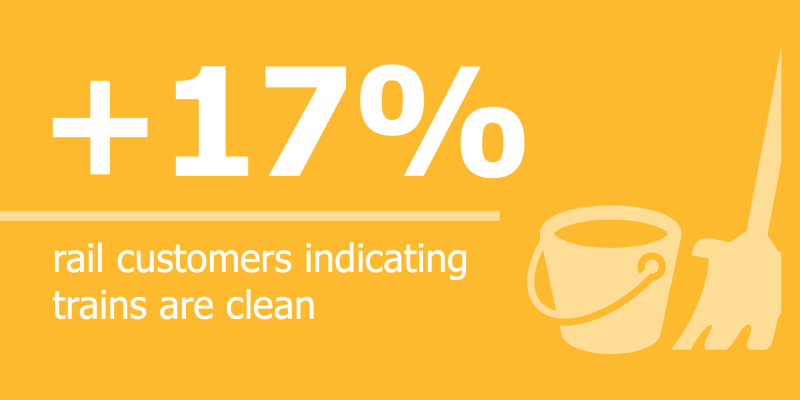 Tareenka: Nadiifinta Gawaarida17% kororka sanadlaha ah ee macaamiisha tareenada ayaa muujinaya in tareenadu nadiif yihiin
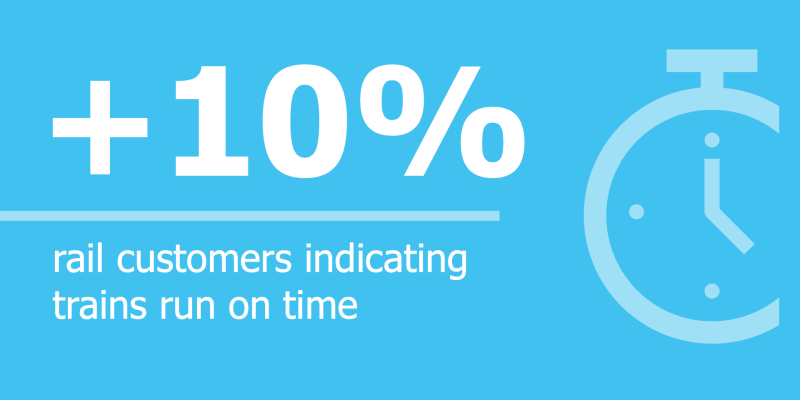 Tareenka: Waxqabadka Waqtiga-Dheer10% koror sanadba sanadka ka dambeeya macaamiisha tareenada ayaa muujinaya in tareenadu ay ku shaqeeyaan waqtigii loogu talagalay
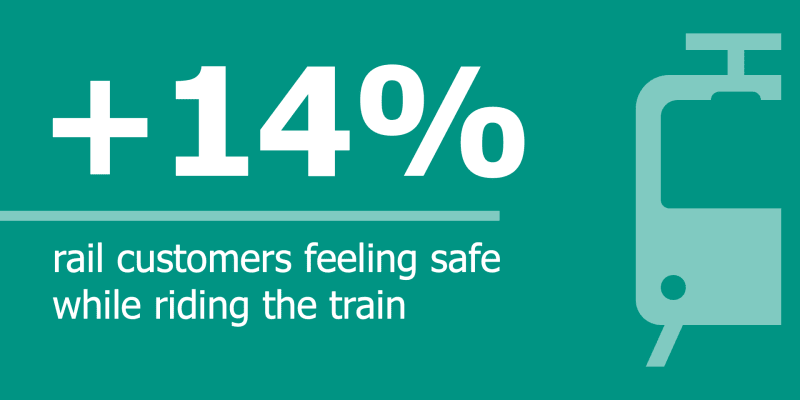 Tareenka: Badbaadada iyo Amniga14% kororka sanadba sanadka ka dambeeya macaamiisha tareenada oo dareemaya ammaan inta ay raacayaan tareenka
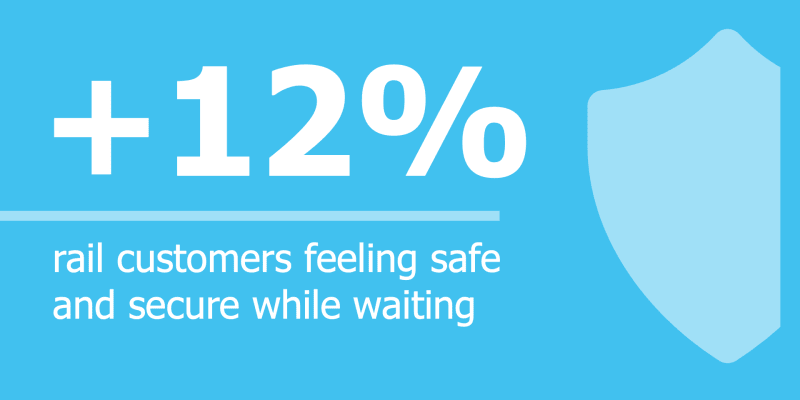 Tareenka: Badbaadada iyo Amniga12% koror sanadba sanadka ka dambeeya ah ayaa ku yimid macaamiisha tareenada oo dareemaya ammaan iyo ammaan inta ay ku sugayaan saldhig
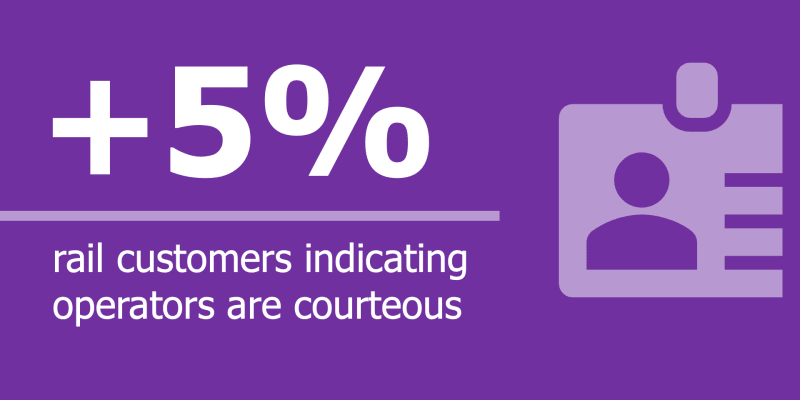 Tareenka: Hawl-wadeennada5% koror sanadba sanadka ka dambeeya macaamiisha ayaa muujinaya in shirkadaha tareenadu ay yihiin kuwo edeb leh
Astaamaha Macaamiisha
Tirakoobka iyo Isticmaalka Gaadiidka
Tareen
- Waxay u badan tahay inay yihiin rag iyo 18-39 sano jir
- 50% Caddaan ama Caddaan
- 17% Hisbaanik, Isbaanish, ama Latino/a/x
- 12% Madow/Afrikaan Ameerikaan ah
- 40% waxay sheegeen in dakhliga qoyska uu ka yar yahay $50,000
- 59% waxay isticmaalaan tareenka saddex maalmood ama ka badan usbuucii
- 65% waxay ku tiirsan yihiin adeegyada tareenka
- 48% waxay tareenada u isticmaalaan inay u safraan shaqada una soo noqdaan
Qanacsanaanta iyo Xushmadda
Bandhigga
Boqolleyda jawaab bixiyayaasha sahanka oo muujinaya inay ku raacsan yihiin (Ku raacsan yihiin ama Si xooggan u raacsan yihiin)
| Su'aal/Mowduuc | 2025 | 2024 | 2023 | Celceliska Qaranka | Isbarbardhigga 2025 iyo 2024 |
|---|---|---|---|---|---|
| Tareenku badanaa wuu ku shaqeeyaa waqtigii loogu talagalay | 62.7% | 53.1% | 53.2% | 53% | +9.6% |
| Tareenku wuxuu i geeyaa meesha aan u socdo waqti macquul ah gudaheed | 78.4% | 71.5% | 62.2% | 71% | +6.9% |
| Inta jeer ee adeeggu uu yahay mid lagu qanco | 69.7% | 62.6% | 61.5% | 57% | +7.1% |
Badbaadada Shaqsiga iyo Raaxada
Boqolleyda jawaab bixiyayaasha sahanka oo muujinaya inay ku raacsan yihiin (Ku raacsan yihiin ama Si xooggan u raacsan yihiin)
| Su'aal/Mowduuc | 2025 | 2024 | 2023 | Celceliska Qaranka | Isbarbardhigga 2025 iyo 2024 |
|---|---|---|---|---|---|
| Waxaan dareemayaa ammaan iyo ammaan inta aan sugayo tareenka | 67.2% | 55.6% | 57.7% | 34% | +11.6% |
| Waxaan dareemaa ammaan iyo ammaan inta aan tareenka saaranahay | 75.5% | 61.7% | 62.6% | 46% | +13.8% |
| Tareenku waa nadiif | 70.8% | 54.2% | 62.0% | 39% | +16.6% |
Helitaanka
Boqolleyda jawaab bixiyayaasha sahanka oo muujinaya inay ku raacsan yihiin (Ku raacsan yihiin ama Si xooggan u raacsan yihiin)
| Su'aal/Mowduuc | 2025 | 2024 | 2023 | Celceliska Qaranka | Isbarbardhigga 2025 iyo 2024 |
|---|---|---|---|---|---|
| Qiimaha qiimaha waa macquul | 77.5% | 76.1% | 63.1% | 60% | +1.4% |
| Saldhigyada/khadadka tareenada ayaa si habboon loogu meeleeyay | 83.3% | 79.0% | 69.6% | 59% | +4.3% |
Hawlgallada
Boqolleyda jawaab bixiyayaasha sahanka oo muujinaya inay ku raacsan yihiin (Ku raacsan yihiin ama Si xooggan u raacsan yihiin)
| Su'aal/Mowduuc | 2025 | 2024 | 2023 | Celceliska Qaranka | Isbarbardhigga 2025 iyo 2024 |
|---|---|---|---|---|---|
| Waxaan dareemayaa in tareenadu ay yihiin kuwo farsamo ahaan ammaan ah | 89.4% | 88.0% | 80.0% | Lama Helin | +1.4% |
| Tareenadu waxay shaqeeyaan maalmaha aan u baahdo | 86.5% | 86.1% | 76.8% | Lama Helin | +0.4% |
| Tareenadu waxay shaqeeyaan waqtiyada aan u baahdo | 77.5% | 70.8% | 66.5% | Lama Helin | +6.7% |
Macluumaadka
Boqolleyda jawaab bixiyayaasha sahanka oo muujinaya inay ku raacsan yihiin (Ku raacsan yihiin ama Si xooggan u raacsan yihiin)
| Su'aal/Mowduuc | 2025 | 2024 | 2023 | Celceliska Qaranka | Isbarbardhigga 2025 iyo 2024 |
|---|---|---|---|---|---|
| Way fududahay in la ogaado haddii tareenadu ay ku shaqeynayaan jadwalka | 66.0% | 59.9% | 61.9% | 56% | +6.1% |
| Haddii RTD ay la kulanto carqalado adeeg, si ku filan ayaan ula socdaa | 55.6% | 50.9% | 56.1% | 60% | +4.7% |
| Waxaan dareemayaa in RTD ay bixisay macluumaad ku filan oo ku saabsan adeegyada ay bixiso | 83.8% | 74.4% | 79.9% | Lama Helin | +9.5% |
| Waxaan dareemayaa inaan xog ogaal u ahay isbeddellada adeegga jadwalka | 62.5% | 54.8% | 59.7% | Lama Helin | +7.8% |
| Macluumaadka ku saabsan jadwalka wadada iyo khariidadaha si fudud ayaa loo heli karaa | 79.6% | 77.9% | 73.8% | Lama Helin | +1.7% |
| Macluumaadka ku saabsan jadwalka wadada iyo khariidadaha waa sax | 78.6% | 72.1% | 71.0% | Lama Helin | +6.5% |
| Guud ahaan, agabka isgaarsiinta ee RTD iyo macluumaadka ku saabsan adeegyada iyo jadwalka waa kuwo tayo sare leh | 73.7% | 67.1% | 70.2% | Lama Helin | +6.6% |
Dhaqanka Hawl-wadeenka
Boqolleyda jawaab bixiyayaasha sahanka oo muujinaya inay ku raacsan yihiin (Ku raacsan yihiin ama Si xooggan u raacsan yihiin)
| Su'aal/Mowduuc | 2025 | 2024 | 2023 | Celceliska Qaranka | Isbarbardhigga 2025 iyo 2024 |
|---|---|---|---|---|---|
| Darawalada tareenku si ammaan ah ayay u shaqeeyaan gaariga | 86.2% | 85.1% | 78.1% | 72% | +1.1% |
| Darawalada tareenku waa edeb badan yihiin | 84.9% | 80.4% | 73.2% | 57% | +4.5% |
| Darawalada tareenku waa kuwo waxtar leh | 82.1% | 77.3% | 73.2% | 61% | +4.8% |
Adeegga Macaamiisha
Boqolleyda jawaab bixiyayaasha sahanka oo muujinaya inay ku raacsan yihiin (Ku raacsan yihiin ama Si xooggan u raacsan yihiin)
| Su'aal/Mowduuc | 2025 | 2024 | 2023 | Celceliska Qaranka | Isbarbardhigga 2025 iyo 2024 |
|---|---|---|---|---|---|
| Su'aashaydii, walaacii, ama cabashadii waa la xalliyay | 61.6% | 56.9% | 58.6% | Lama Helin | +4.8% |
| Xallinta khilaafka waxaa la gaaray waqtigii loogu talagalay | 84.1% | 93.2% | 92.7% | Lama Helin | -9.1% |
| Wakiilada adeegga macaamiisha ee RTD waa kuwo edeb leh | 68.4% | 69.6% | 66.0% | Lama Helin | -1.2% |
Meelaha loo socdo iyo Maalgelinta
Boqolleyda jawaab bixiyayaasha sahanka oo muujinaya inay ku raacsan yihiin (Ku raacsan yihiin ama Si xooggan u raacsan yihiin)
| Su'aal/Mowduuc | 2025 | 2024 | 2023 | Celceliska Qaranka | Isbarbardhigga 2025 iyo 2024 |
|---|---|---|---|---|---|
| RTD waxay bixisaa marin u helidda goobaha muhiimka ah ee adeegga dadweynaha | 85.5% | 84.3% | 75.8% | Lama Helin | +1.2% |
| Hay'adaha gaarka loo leeyahay, kuwa aan faa'iido doonka ahayn, iyo dowladaha hoose waa inay tixgeliyaan kordhinta maalgelinta si loo horumariyo tayada iyo/ama loo ballaariyo adeegyada | 84.4% | 88.6% | 75.8% | Lama Helin | -4.3% |
Qiimaha Bulshada
Boqolleyda jawaab bixiyayaasha sahanka oo muujinaya inay ku raacsan yihiin (Ku raacsan yihiin ama Si xooggan u raacsan yihiin)
| Su'aal/Mowduuc | 2025 | 2024 | 2023 | Celceliska Qaranka | Isbarbardhigga 2025 iyo 2024 |
|---|---|---|---|---|---|
| RTD waxay qiimo u siisaa bulshada | 86.6% | 85.0% | 79.0% | 73% | +1.6% |
Paratransit: Natiijooyinka Sahanka
Dhibcaha Dhiirrigeliyaha Shabakadda Macaamiisha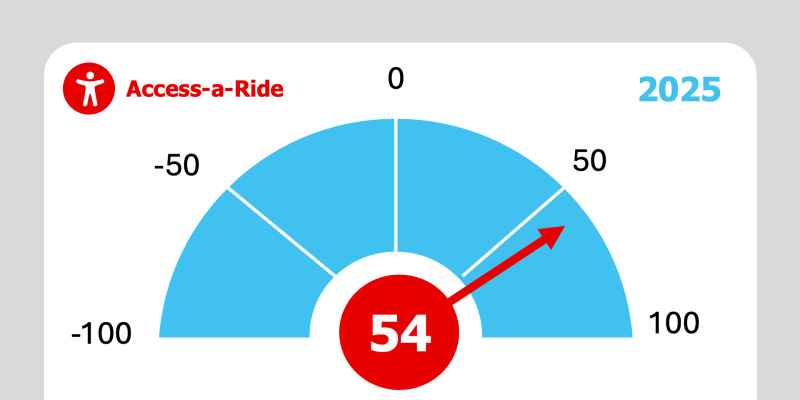 2025Dhibcaha NPS ee Helitaanka-a-Ride: +54
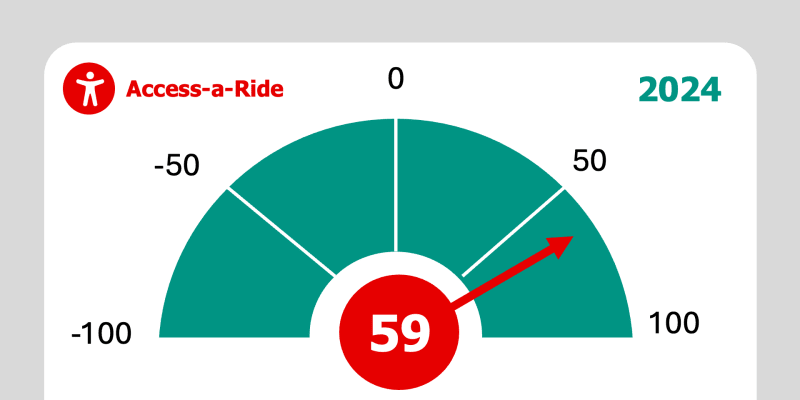 2024Dhibcaha NPS ee Helitaanka-a-Ride: +59
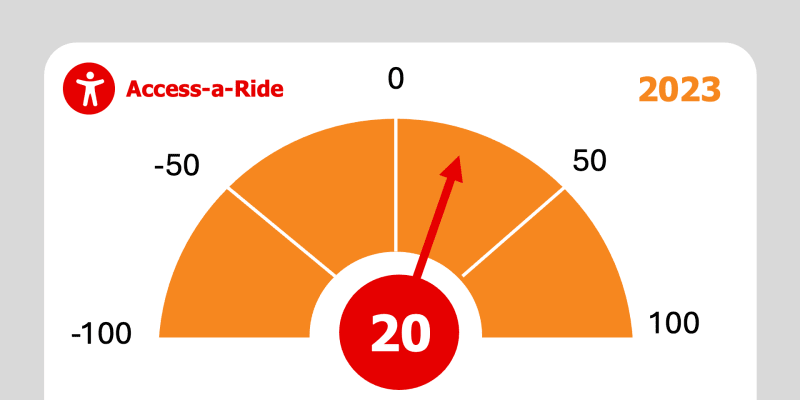 2023Dhibcaha NPS ee Helitaanka-Ride: +20
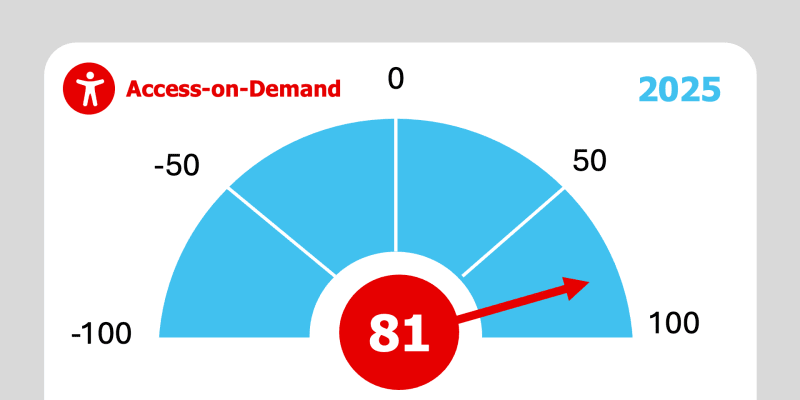 2025Dhibcaha NPS ee Helitaanka-Marka Baahan Yahay: +81
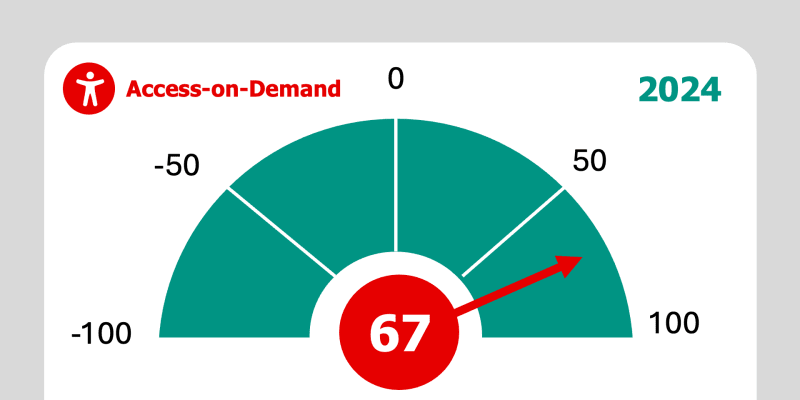 2024Dhibcaha NPS ee Helitaanka-Marka Baahan Yahay: +67
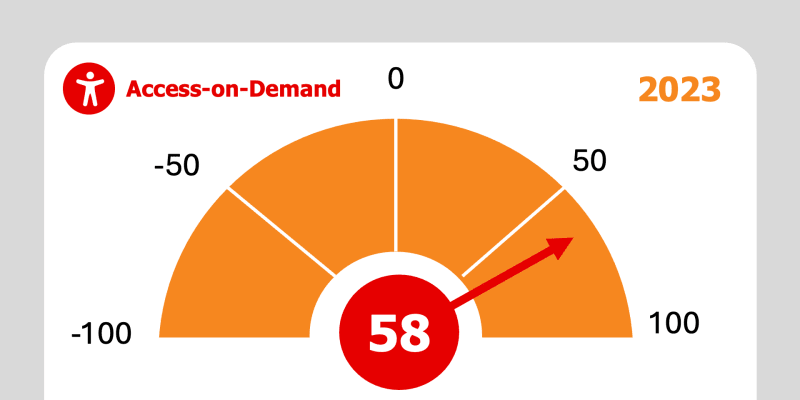 2023Dhibcaha NPS ee Helitaanka-Marka Baahan Yahay: +58
Astaamaha Macaamiisha
Tirakoobka iyo Isticmaalka Gaadiidka
Paratransit
- Waxay u badan tahay inay yihiin dumar iyo da' ka weyn 65 sano
- AaR: 64% AoD: 66% Cadaan ama Caddaan
- AaR: 16% AoD: 12% Hisbaanik, Isbaanish, ama Latino/a/x
- AaR: 18% AoD: 15% Madow/Afrikaan Ameerikaan ah
- AaR:86% AoD:90% dakhliga qoyska ee la soo sheegay wuxuu ka yar yahay $50,000
- AaR: 52% dadka isticmaala ee la wareystay waxay isticmaalaan AaR inta badan safarradooda
- AaR: 41% waxay u isticmaalaan adeegyada ballamaha caafimaadka
- AoD: 74% dadka isticmaala ee la wareystay waxay isticmaalaan AoD si ay u sameeyaan inta badan safarradooda
- AOD: 45% waxay u isticmaalaan adeegyada ballamaha caafimaadka
Sannadka: Helitaanka-a-Ride
AOD: Helitaanka Baahida
Qanacsanaanta iyo Xushmadda
Qanacsanaanta Guud
Boqolleyda jawaab bixiyayaasha sahanka oo muujinaya qanacsanaan (Ku qanacsan ama Aad u Qanacsan)
| Su'aal/Mowduuc | 2025 | 2024 | 2023 | Celceliska Qaranka | Isbarbardhigga 2025 iyo 2024 |
|---|---|---|---|---|---|
| Helitaanka-a-Ride | 84% | 80% | Lama Helin | +4% | |
| Helitaanka Baahida | 97% | 86% | +11% |

Sahanka Qiimaha Bulshada
Marka laga soo tago inay si toos ah uga soo ururiso jawaab celinta macaamiisha, RTD waxay sidoo kale weydiisatay jawaab celin gaar ah qoysaska ku nool agagaarka Denver.
Bulshada: Natiijooyinka Sahanka
Dhibcaha Dhiirrigeliyaha Shabakadda Bulshada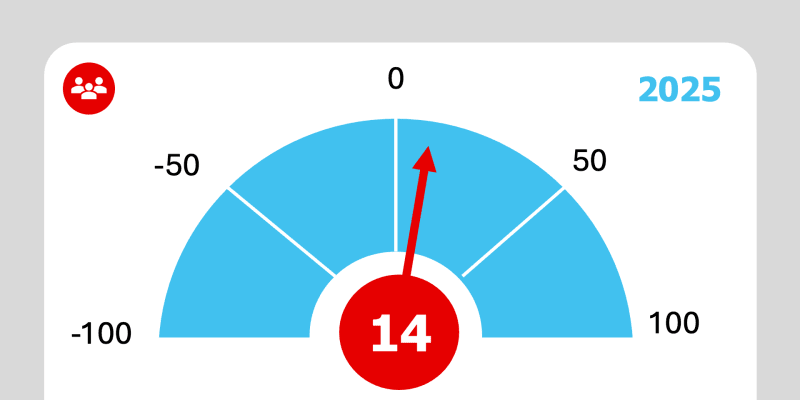 2025Dhibcaha NPS ee Bulshada: +14
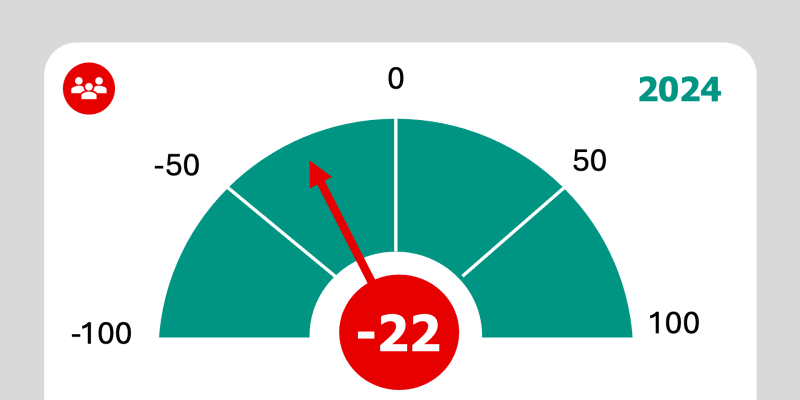 2024Dhibcaha NPS ee Bulshada: -22
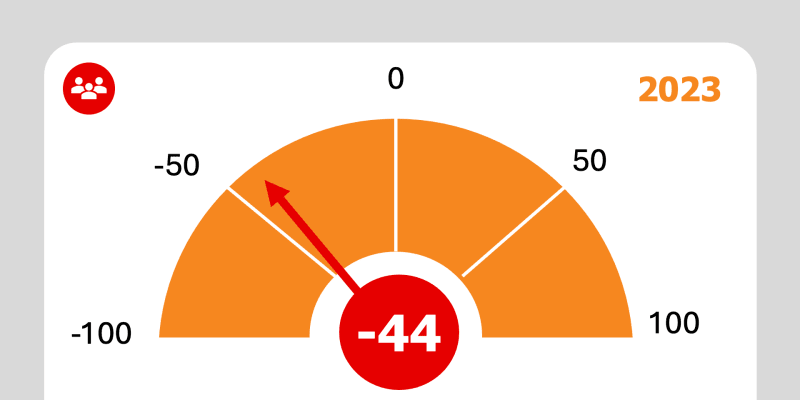 2023Dhibcaha NPS ee Bulshada: -44
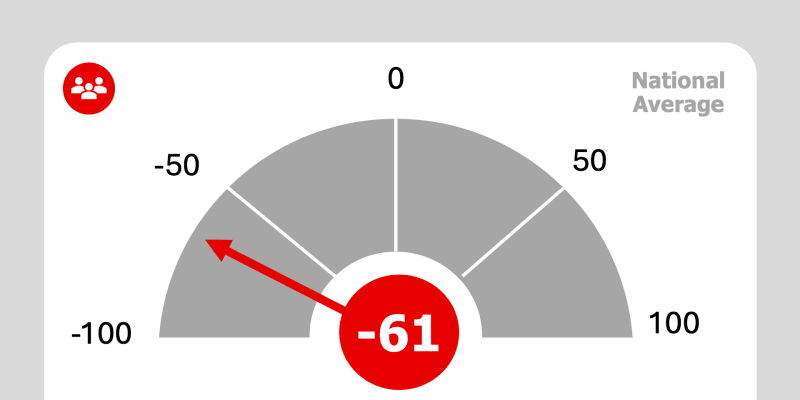 Celceliska QarankaDhibcaha NPS ee Bulshada: -61
Qiimaha RTD
Aragtida Qiimaha
Boqolleyda jawaab bixiyayaasha sahanka oo tilmaamaya Qiimo badan ama Qiimo aad u badan
| Su'aal/Mowduuc | 2025 | 2024 | 2023 | Celceliska Qaranka | Isbarbardhigga 2025 iyo 2024 |
|---|---|---|---|---|---|
| Qiimaha gobolka weyn ee Denver | 86% | 86% | 84% | 66% | +0% |
| Qiimaha adiga shaqsi ahaan | 73% | 62% | 54% | 31% | +11% |
| Bixinta fursadaha gaadiidka dadka qaba baahiyaha gaarka ah ee dhaqdhaqaaqa | 88% | 88% | 82% | 78% | +0% |
| Bixinta fursado gaadiid oo la awoodi karo | 82% | 80% | 78% | 77% | + 2% |
| Hagaajinta tayada nolosha | 76% | 75% | 66% | 56% | +1% |
| Soo jiidashada iyo haysashada fursado shaqo oo badan oo gobolka ah | 64% | 65% | 62% | 54% | -1% |
| Yaraynta ciriiriga taraafikada | 80% | 78% | 75% | 56% | + 2% |
| Ka dhigista waddooyinka kuwo ammaan ah dhammaan isticmaalayaasha | 74% | 73% | 68% | 45% | +1% |
| Bixinta marin u helidda goobaha shaqada | 77% | 73% | 68% | 69% | +4% |
| Bixinta helitaanka xarumaha caafimaadka | 69% | 69% | 62% | 77% | +0% |
| Bixinta helitaanka xarumaha waxbarashada | 78% | 81% | 75% | 72% | -3% |
| Bixinta marin u helidda meelaha madadaalada | 76% | 77% | 73% | 57% | -1% |
| Gaaritaanka dhaqamada waara, yaraynta wasakhowga iyo raadadka kaarboonka | 83% | 83% | 82% | 58% | +0% |
| Bixinta beddel gaadiid oo ammaan ah | 81% | 77% | 73% | 74% | +4% |
| Bixinta marin u helidda gobolka, magaalooyinka iyo degmooyinka ku xeeran | 69% | 71% | 61% | 69% | -2% |
| Taageeridda ganacsiga bulshada | 68% | 72% | 64% | Lama Helin | -4% |
| Bixinta fursado lagu helo guryo la awoodi karo | 63% | 63% | 53% | Lama Helin | +0% |
Fursad La Xiriirta Adeegga
Aragtida Xushmadda
Boqolleyda jawaab bixiyayaasha sahanka oo muujinaya inay ku raacsan yihiin (Ku raacsan yihiin ama Si xooggan u raacsan yihiin)
| Su'aal/Mowduuc | 2025 | 2024 | 2023 | Celceliska Qaranka | Isbarbardhigga 2025 iyo 2024 |
|---|---|---|---|---|---|
| Waxaan leeyahay aragti wanaagsan oo ku saabsan summada RTD | 48% | 46% | 44% | 45% | + 2% |
| Waxaan dareemayaa ammaan shaqsi ahaan ah markaan isticmaalayo adeegyada RTD | 46% | 43% | 40% | 55% | +3% |
| RTD si ku filan ayay ugu adeegtaa xarumaha shaqada | 44% | 36% | 36% | 32% | + 8% |
| Warbixinta maaliyadeed ee RTD waa mid la fahmi karo oo hufan | 27% | 25% | 20% | 22% | + 2% |
| Waxaan dareemayaa in gawaarida RTD ay yihiin kuwo farsamo ahaan ammaan ah | 90% | 85% | 88% | 55% | +5% |
| Adeegyada RTD waxaa heli kara dadka naafada ah ee kala duwan | 76% | 72% | 74% | 42% | +4% |
| RTD waa kheyraad bulsho oo kala duwan, siman, oo loo dhan yahay | 71% | 63% | 61% | Lama Helin | + 8% |
| Adeegga RTD wuxuu taageeraa ganacsiga bulshada | 52% | 48% | 45% | Lama Helin | +4% |
| Maalgashiga bulshadu ee gaadiidka wuxuu bixiyaa qiimo | 82% | 81% | 80% | Lama Helin | +1% |
| RTD waa la aamini karaa | 44% | 40% | 37% | 55% | +4% |
| RTD waa maamule wanaagsan oo lacagaha dadweynaha ah | 33% | 29% | 27% | Lama Helin | +4% |
| RTD si fiican ayay u maamushaa kheyraadkeeda dhaqaale | 21% | 19% | 14% | Lama Helin | + 2% |