ग्राहक र समुदाय सर्वेक्षणहरू
नतिजा, मुख्य बुँदाहरू, र हाइलाइटहरू
RTD मा, हाम्रा ग्राहकहरू र हामीले सेवा गर्ने समुदायहरूसँग जोडिएर हामीलाई आवश्यकता, अपेक्षा र अनुभवहरू राम्रोसँग बुझ्न अनुमति दिन्छ। हाम्रा ग्राहकहरू र समुदायसँग जोडिने एउटा तरिका भनेको एजेन्सीको कार्यसम्पादन मापन गर्न वार्षिक सर्वेक्षणहरू सञ्चालन गर्नु हो।
२०२५ ग्राहक उत्कृष्टता सर्वेक्षण र सामुदायिक मूल्य सर्वेक्षण के राम्रोसँग काम गरिरहेको छ र कहाँ थप सुधारहरू आवश्यक पर्न सक्छ भन्ने बारे हामीलाई अन्तर्दृष्टि प्रदान गर्नुहोस्। यो डेटाको ध्यानपूर्वक समीक्षा गर्नाले हामीलाई प्रवृत्तिहरू पहिचान गर्न, चिन्ताहरूलाई सम्बोधन गर्न र सञ्चालन र सेवाहरूमा सूचित वृद्धि गर्न अनुमति दिन्छ। यो प्रक्रियाले RTD लाई दक्षता र ग्राहक सन्तुष्टिलाई अनुकूलन गर्न मात्र मद्दत गर्दैन, तर यसले सुन्ने र निरन्तर सुधार गर्ने प्रतिबद्धता प्रदर्शन गरेर विश्वास र पारदर्शितालाई बढावा दिन्छ। सर्वेक्षण परिणामहरूको बारेमा थप पढ्नको लागि, RTD को न्युज स्टप पृष्ठमा जानुहोस्।
यस पृष्ठमा:

सर्वेक्षणहरूको सिंहावलोकन

लगातार पाँचौं वर्ष, RTD ले एजेन्सीको शक्तिहरू राम्रोसँग बुझ्न र सुधारका अवसरहरू पहिचान गर्न आफ्ना ग्राहकहरू र समुदायको सर्वेक्षण गरेको छ।
RTD ले फेरि एक पटक सम्झौता गर्यो ETC संस्थान, एक राष्ट्रिय, तेस्रो-पक्ष अनुसन्धान फर्म, २०२५ मा आफ्नो वार्षिक सर्वेक्षण सञ्चालन गर्न। ETC संस्थानले सरकारी एजेन्सीहरू, गैर-नाफामुखी संस्थाहरू, र सार्वजनिक-सेवा संस्थाहरूको लागि समुदाय, यातायात, सार्वजनिक सुरक्षा, र अन्य प्रकारका बाह्य सर्वेक्षणहरूमा विशेषज्ञता राख्छ। ETC संस्थानले १,००० समुदायहरूमा ३२ लाख भन्दा बढी सर्वेक्षणहरू सञ्चालन गरेको छ, जसले राष्ट्रिय बेन्चमार्क डेटा र मेट्रिक्सको लागि मानक सेट गरेको छ।
अनुसन्धान फर्मको दशकौंको अनुभवले स्थानीय सरकारहरू र सार्वजनिक संस्थाहरूलाई विशेषज्ञ-डिजाइन गरिएका सर्वेक्षणहरू, बलियो डेटा विश्लेषण, र अन्तर्दृष्टिपूर्ण रिपोर्टिङ मार्फत जनभावनालाई राम्रोसँग बुझ्न मद्दत गर्दछ।
कार्यप्रणाली र आत्मविश्वास अन्तरालहरू
दर्शक, सङ्कलन अवधि, र सर्वेक्षण विधि
अप्रिल २०२५ मा, आफ्ना ग्राहकहरू र समुदायको धारणा, मनोवृत्ति, अनुभव र विचारहरू राम्रोसँग बुझ्नको लागि चार अलग-अलग तथ्याङ्कीय रूपमा मान्य सर्वेक्षणहरू सञ्चालन गरियो।
| सर्वेक्षण | दर्शक | सङ्कलन अवधि | विधि | सम्पन्न सर्वेक्षणहरू | आत्मविश्वास अन्तराल |
|---|---|---|---|---|---|
| सामुदायिक मूल्य | जनसांख्यिकीको अनुपातमा महानगरीय क्षेत्रका घरपरिवारहरू | अप्रिल २०२५ | मेल, इमेल, र पाठ | ७७० | ९५% विश्वास स्तरमा +/- ३.८% |
| ग्राहक उत्कृष्टता: बस | सबै बस रुटहरू, वसन्त २०२५ को बोर्डिङको अनुपातमा | अप्रिल २०२५ | ग्राहक अवरोध | १,०६३ | ९५% विश्वास स्तरमा +/- २.८% |
| ग्राहक उत्कृष्टता: रेल | सबै रेल लाइनहरू, वसन्त २०२५ को बोर्डिङको अनुपातमा | अप्रिल २०२५ | ग्राहक अवरोध | ७५८ | ९५% विश्वास स्तरमा +/- २.८% |
| ग्राहक उत्कृष्टता: प्याराट्रान्जिट | दर्ता गरिएका प्याराट्रान्जिट ग्राहकहरू | अप्रिल २०२५ | मेल, इमेल, र पाठ | ४४४ | ९५% विश्वास स्तरमा +/- ४.९% |
ग्राहक अवरोध विधि
बस र रेल सर्वेक्षणहरू a प्रयोग गरेर सञ्चालन गरिएको थियो ग्राहक अवरोध विधि, जसले अनुसन्धानकर्ताहरूलाई RTD का सेवाहरू प्रयोग गर्ने व्यक्तिहरूबाट तत्काल, वास्तविक-समय प्रतिक्रिया सङ्कलन गर्न अनुमति दियो। यो सर्वेक्षण विधिले वास्तविक ग्राहकहरूद्वारा प्रतिक्रिया प्रदान गरिएको सुनिश्चित गर्दछ, र सङ्कलन गरिएको डेटा विशिष्ट बस मार्गहरू, रेल लाइनहरू, र ट्रान्जिट सेवाहरूको समानुपातिक छ।
आत्मविश्वास अन्तरालहरू
द विश्वास अन्तराल सर्वेक्षणको तथ्याङ्कको आधारमा, सम्पूर्ण जनसंख्याको वास्तविक प्रतिक्रियाहरू कुन दायरा भित्र घट्ने सम्भावना छ भन्ने कुरा जनाउँछ। RTD को सर्वेक्षणहरू ९५% विश्वास स्तरमा व्यक्त गरिन्छ, जसको अर्थ यदि एउटै सटीक सर्वेक्षण १०० पटक गरिएको थियो भने, परिणामहरू ९५ पटक त्यो दायरा भित्र पर्नेछन्। यसले सर्वेक्षणको नतिजा तथ्याङ्कीय रूपमा मान्य र सबै ग्राहकहरू र समुदायको प्रतिनिधित्व गर्ने कुरा सुनिश्चित गर्न मद्दत गर्दछ।
ETC संस्थानको राष्ट्रिय तुलनात्मक ट्रान्जिट डेटा देशव्यापी सयौं शहरहरूमा गरिएका घरपरिवार सर्वेक्षणहरूबाट सङ्कलन गरिन्छ।
मुख्य टेकवे र हाइलाइटहरू
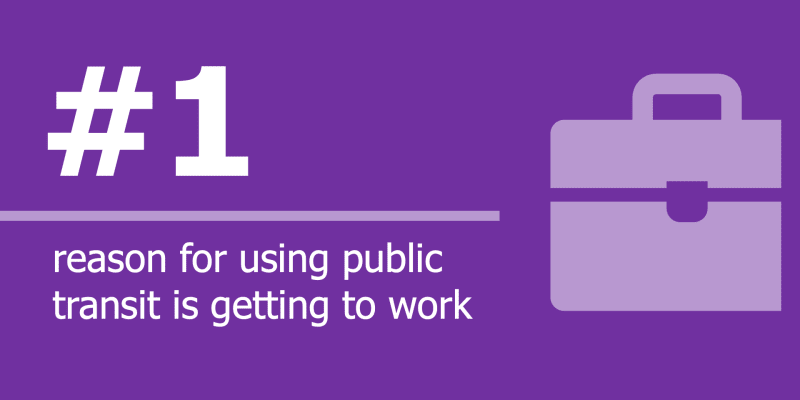 ट्रान्जिट प्रयोगमानिसहरूले RTD को बस र रेल सेवाहरू प्रयोग गर्नुको पहिलो कारण काममा पुग्नु हो, २०२४ बाट ७% ले वृद्धि भएको छ।
 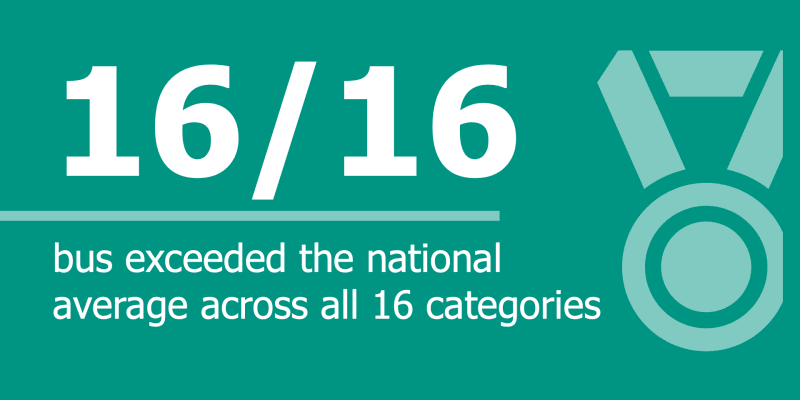 बस: राष्ट्रिय औसतसबै १६ सर्वेक्षण कोटीहरूमा बसले राष्ट्रिय औसतभन्दा बढी मूल्य चुकायो
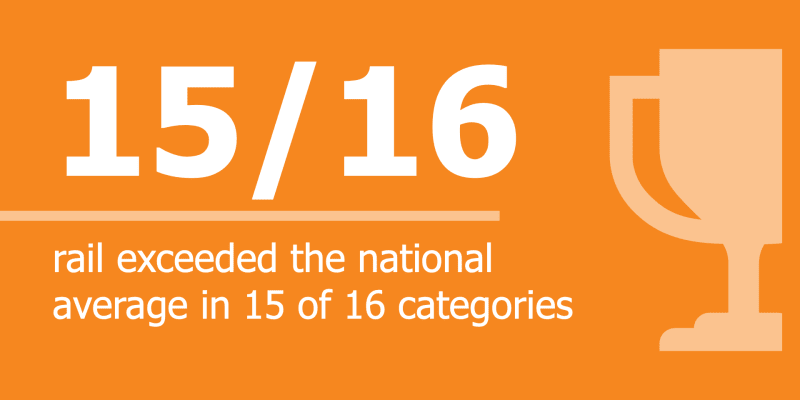 रेल: राष्ट्रिय औसत१६ सर्वेक्षण कोटीहरू मध्ये १५ मा रेलले राष्ट्रिय औसत नाघेको छ।
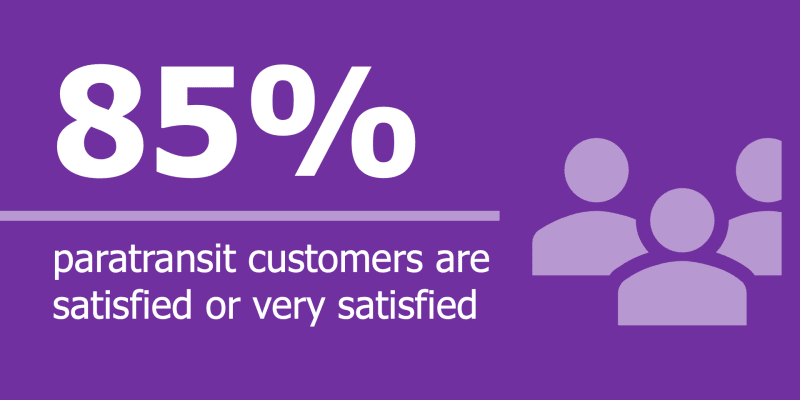 प्याराट्रान्जिट: समग्र सन्तुष्टि८५% प्याराट्रान्जिट ग्राहकहरू RTD को सेवाहरूसँग सन्तुष्ट वा धेरै सन्तुष्ट छन्।
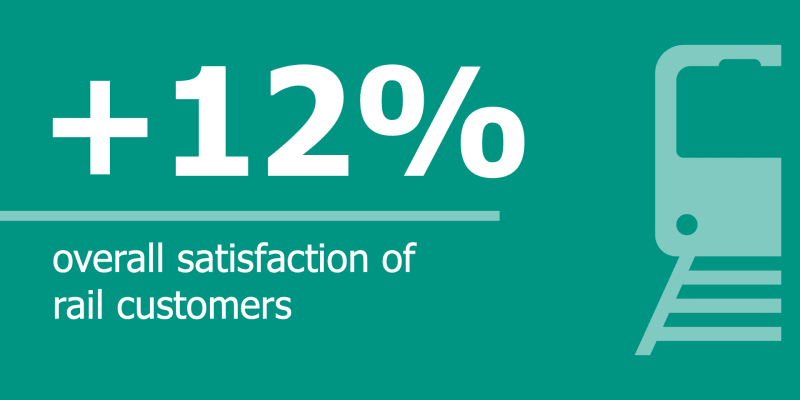 रेल: समग्र सन्तुष्टिरेल ग्राहकहरूको समग्र सन्तुष्टिमा वर्ष-दर-वर्ष १२% वृद्धि
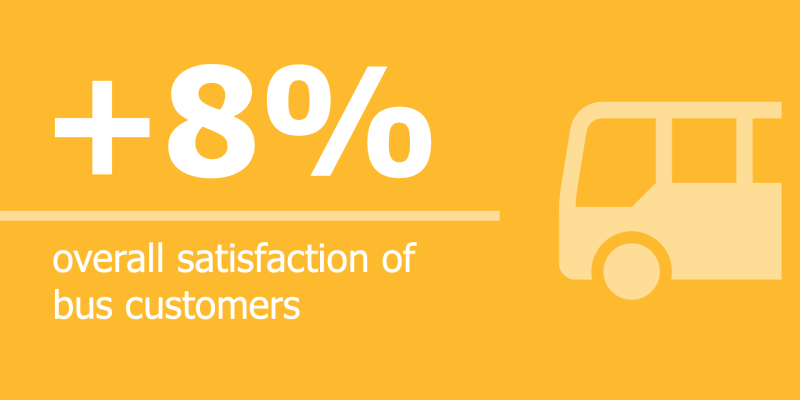 बस: समग्र सन्तुष्टिबस ग्राहकहरूको समग्र सन्तुष्टिमा वर्ष-दर-वर्ष ८% वृद्धि
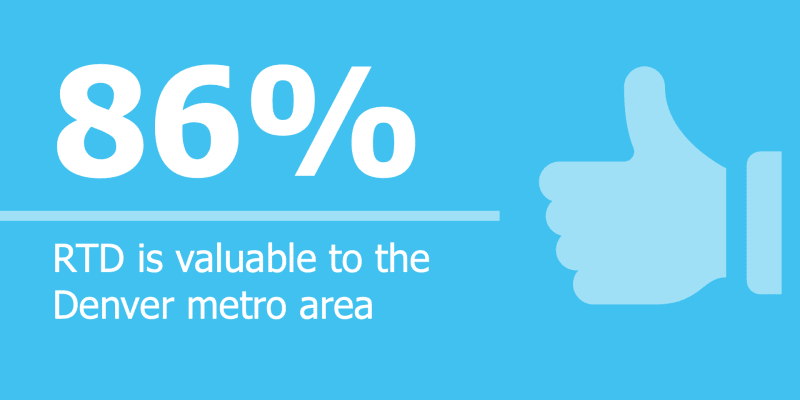 समुदाय: RTD को मूल्यसमुदायको ८६% ले विश्वास गर्छन् कि RTD ले डेनभर मेट्रो क्षेत्रलाई मूल्य प्रदान गर्दछ।
 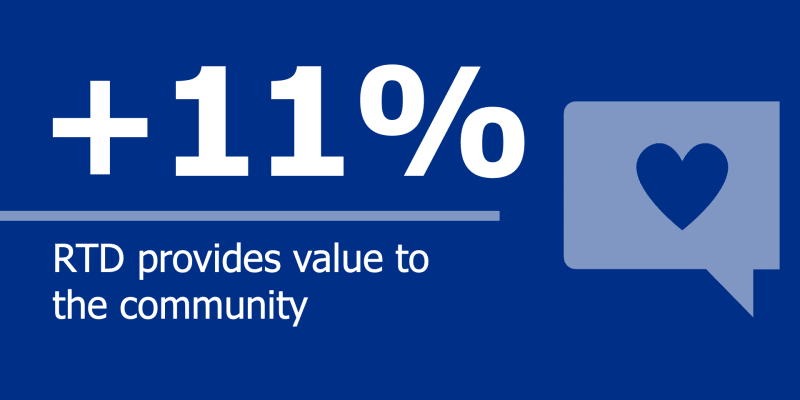 समुदाय: RTD को मूल्यसमुदायमा वर्ष-दर-वर्ष ११% वृद्धिले RTD ले मूल्य प्रदान गर्दछ भन्ने संकेत गर्दछ।
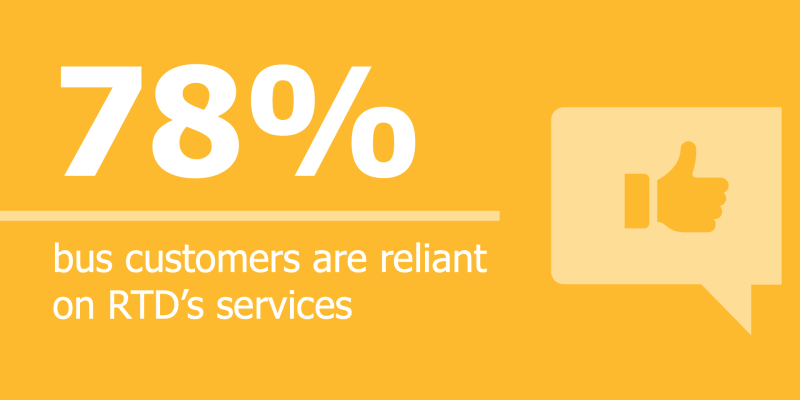 बस: ग्राहकको विशेषता७८% बस ग्राहकहरू RTD को सेवाहरूमा निर्भर छन्।
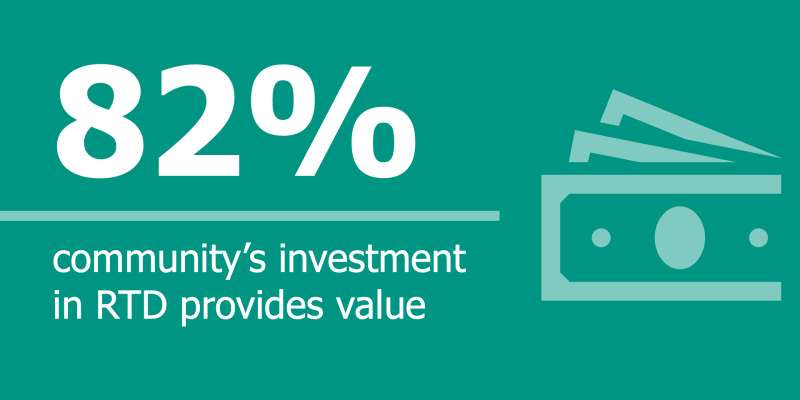 समुदाय: RTD को मूल्यसमुदायका ८२% ले RTD मा गरेको लगानीले मूल्य प्रदान गर्ने विश्वास गर्छन्
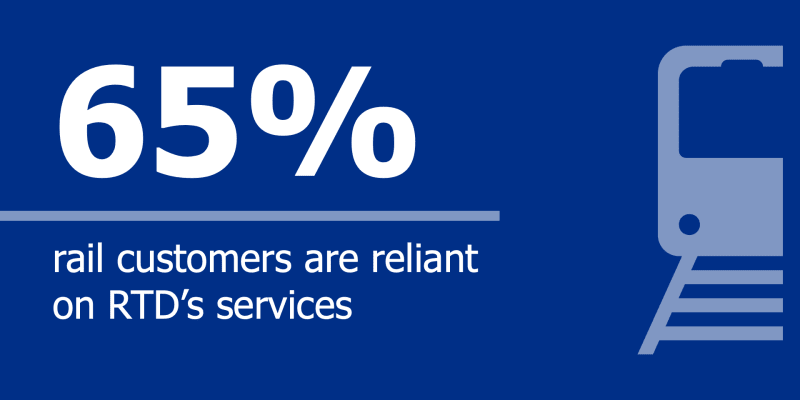 रेल: ग्राहक विशेषता६५% रेल ग्राहकहरू RTD को सेवाहरूमा निर्भर छन्।
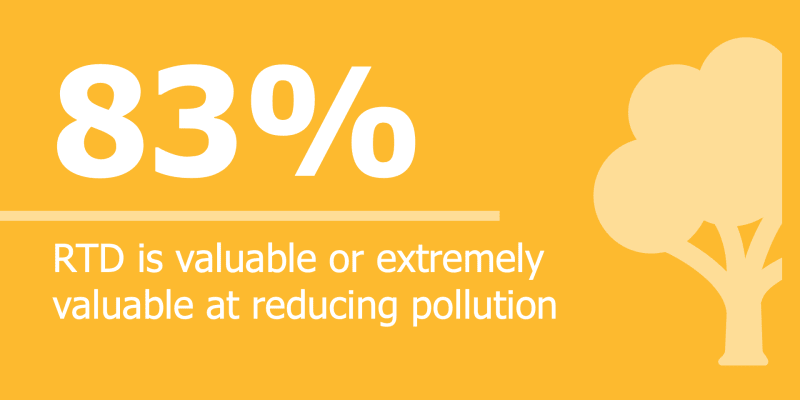 समुदाय: प्रदूषण घटाउने८३% समुदायले प्रदूषण कम गर्न र दिगो अभ्यासहरू प्राप्त गर्न आरटीडी मूल्यवान वा अत्यन्तै मूल्यवान छ भन्ने विश्वास गर्छन्।
| २०२५ | २०२४ | २०२३ | २०२५ बनाम २०२४ को तुलना | |
|---|---|---|---|---|
| काम | ४१% | ३४% | २७% | +७% |
| फुर्सद, सामाजिक, वा मनोरञ्जन | ३५% | ४२% | ५४% | -७% |
| विद्यालय | ६% | ४% | ५% | +२% |
| किनमेल, किराना सामान, वा कामहरू | ९% | ७% | ४% | +२% |
| मेडिकल | ५% | ४% | २% | +१% |
| धार्मिक गतिविधिहरू | ०% | १% | १% | -१% |
| अन्य | ६% | ९% | ७% | -३% |

ग्राहक उत्कृष्टता सर्वेक्षणहरू
ग्राहक उत्कृष्टतासँग सम्बन्धित RTD को कार्यसम्पादन मूल्याङ्कन गर्न तीन ग्राहक-मुखी सर्वेक्षणहरू सञ्चालन गरिएको थियो, जुन एजेन्सीले अपनाएको चार मध्ये एक थियो। रणनीतिक प्राथमिकताहरू। प्रत्येक सर्वेक्षणले बस, रेल र प्याराट्रान्जिट ग्राहकहरूमा छुट्टाछुट्टै केन्द्रित थियो, र बस र रेल सर्वेक्षणहरू सवारी साधनमा अवरोध विधि मार्फत सञ्चालन गरिएको थियो। नमूना योजना सम्पूर्ण सेवा क्षेत्र समावेशी थियो र सबै बस मार्गहरू र रेल लाइनहरू, साथै दर्ता गरिएका प्याराट्रान्जिट ग्राहकहरूलाई समावेश गरिएको थियो।
खुद प्रमोटर स्कोर
NPS अवलोकन
RTD को ग्राहक र सामुदायिक सर्वेक्षणहरूले प्रदान गर्ने एउटा महत्त्वपूर्ण मेट्रिक भनेको नेट प्रमोटर स्कोर (NPS) हो। NPS ले -१०० देखि +१०० सम्मको स्केलको आधारमा मानिसहरूले अरू कसैलाई RTD को सेवाहरू सिफारिस गर्ने सम्भावना कति छ भनेर मापन गर्छ।
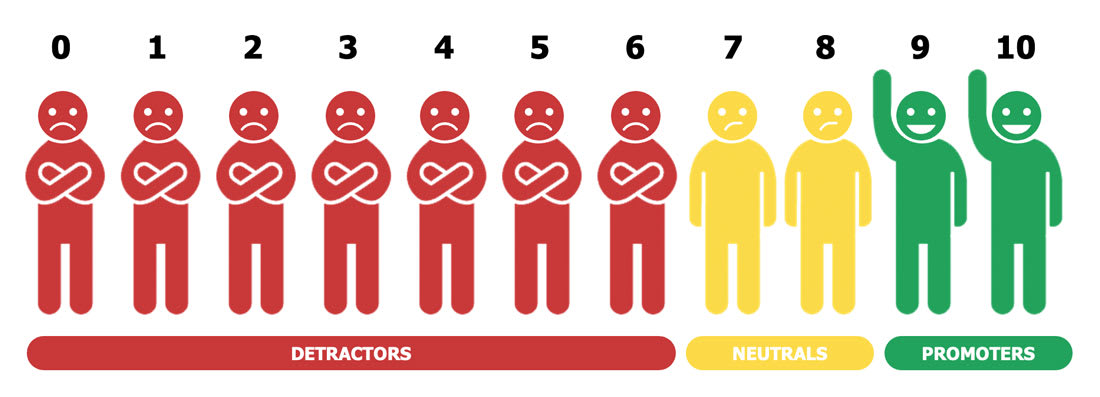
सर्वेक्षणका प्रतिक्रियाहरूलाई तीन वर्गमा वर्गीकृत गरिएको छ:
- प्रवर्द्धकहरू (९-१०)
- निष्क्रिय (७-८)
- विरोधीहरू (०–६)
NPS गणना गर्दै
प्रवर्द्धकहरूको प्रतिशतबाट विरोधीहरूको प्रतिशत घटाएर स्कोर गणना गरिन्छ, जसले समग्र सन्तुष्टि, वफादारी र RTD का सेवाहरू सिफारिस गर्न इच्छुकताको भावना दिन्छ।

- -१०० देखि ० सम्म: सुधारको आवश्यकता छ
- ० देखि २० सम्म: राम्रो
- २१ देखि ५० सम्म: अनुकूल
- ५१ देखि ८० सम्म: उत्कृष्ट
- ८१ देखि १०० सम्म: विश्वस्तरीय
खुद प्रमोटर स्कोर
संयुक्त बस, रेल, र प्याराट्रान्जिट ग्राहकहरू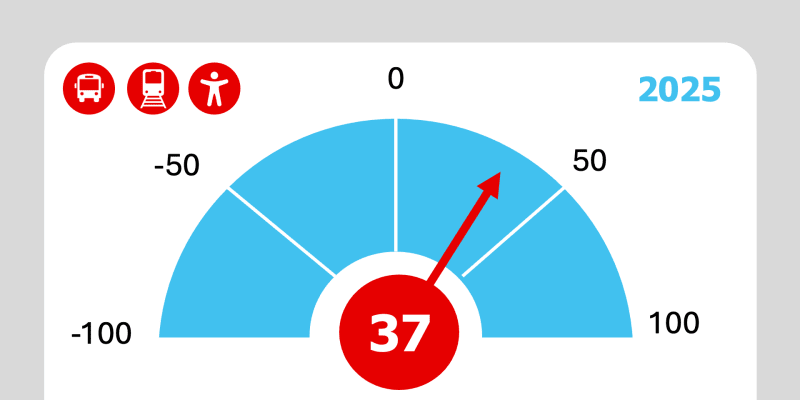 २०२५संयुक्त NPS स्कोर: +३७
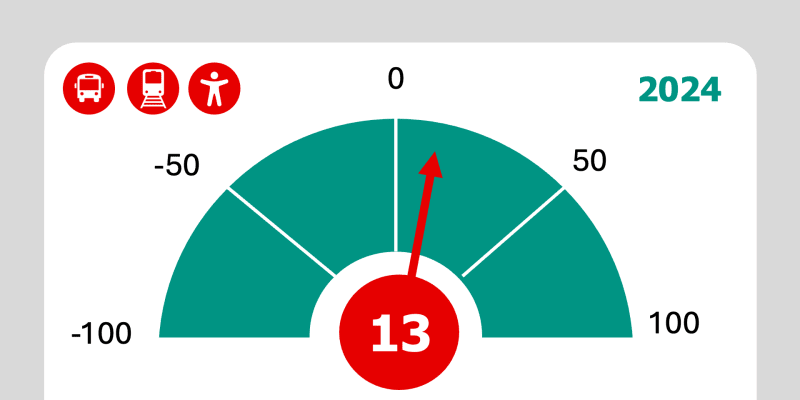 २०२४संयुक्त NPS स्कोर: +१३
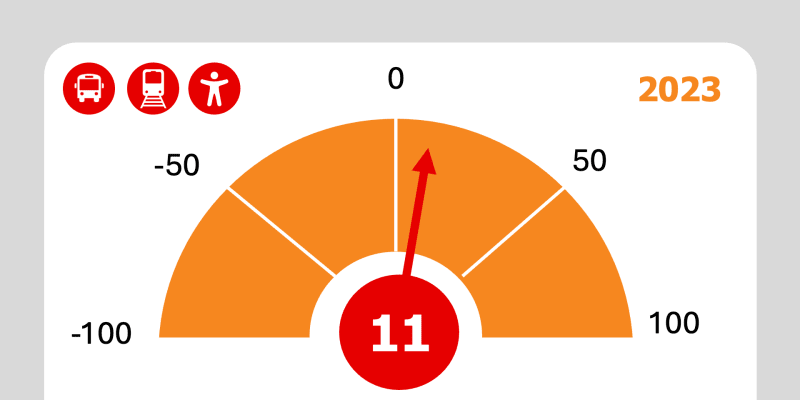 २०२३संयुक्त NPS स्कोर: +११
बस: सर्वेक्षण परिणामहरू
ग्राहक नेट प्रवर्द्धक स्कोर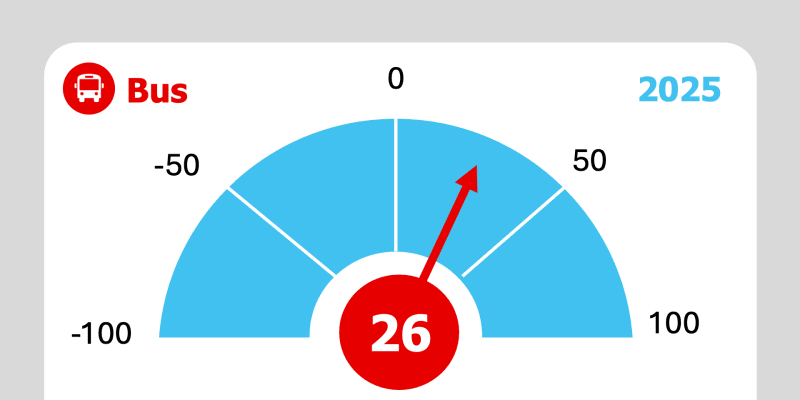 २०२५बस NPS स्कोर: +२६
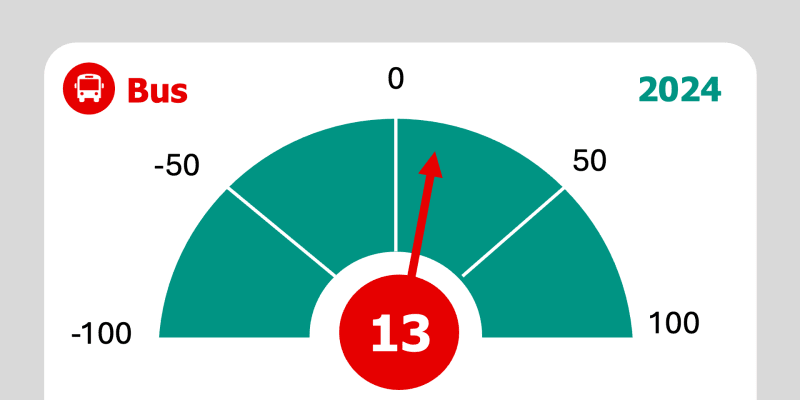 २०२४बस NPS स्कोर: +१३
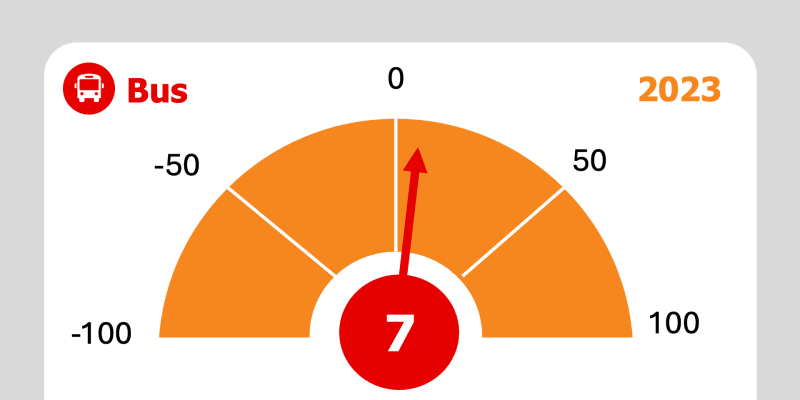 २०२३बस NPS स्कोर: +७
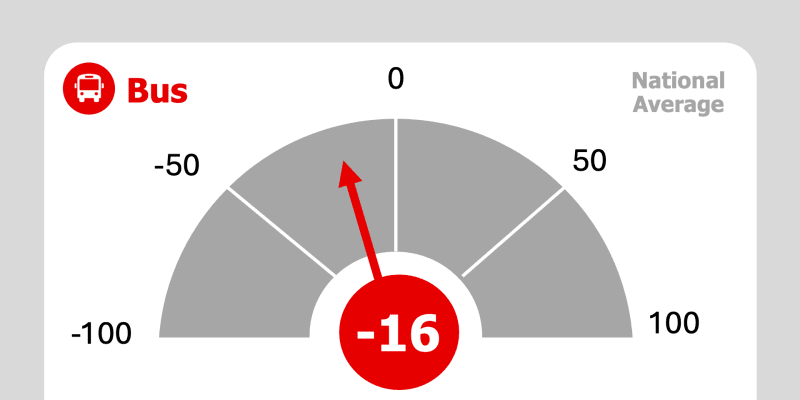 राष्ट्रिय औसतबस NPS स्कोर: -१६
बस: मुख्य कुराहरू र हाइलाइटहरू
बस: राष्ट्रिय औसतसबै १६ सर्वेक्षण कोटीहरूमा बसले राष्ट्रिय औसतभन्दा बढी मूल्य चुकायो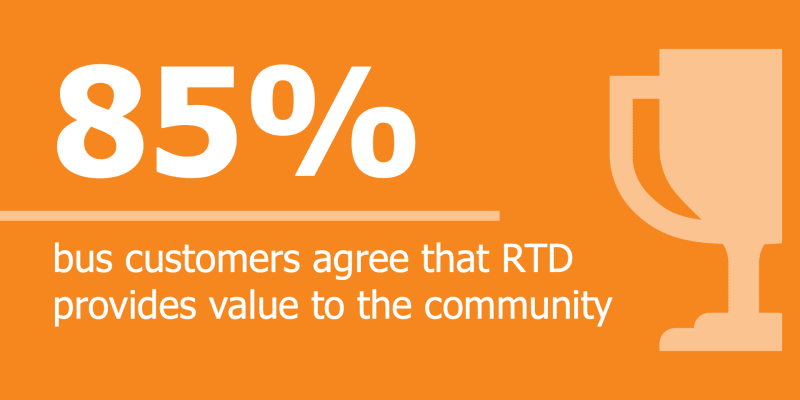 बस: RTD को मूल्य८५% बस ग्राहकहरू सहमत छन् कि RTD ले समुदायलाई मूल्य प्रदान गर्दछ।
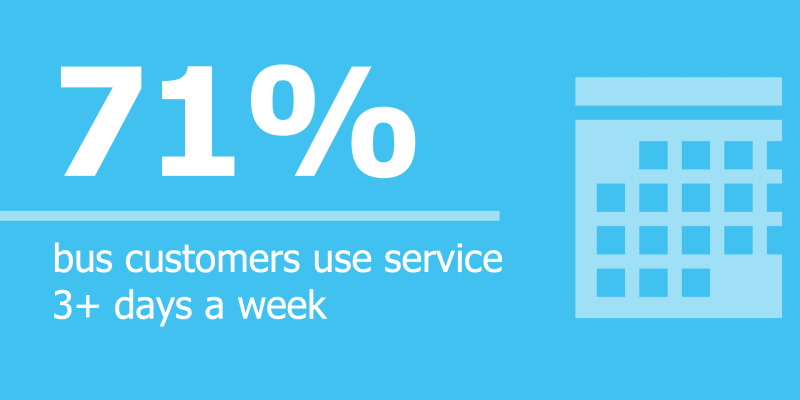 बस: ग्राहकको विशेषता७१% बस ग्राहकहरूले हप्तामा तीन वा सोभन्दा बढी दिन RTD को सेवाहरू प्रयोग गर्छन्।बस: समग्र सन्तुष्टिबस ग्राहकहरूको समग्र सन्तुष्टिमा वर्ष-दर-वर्ष ८% वृद्धि
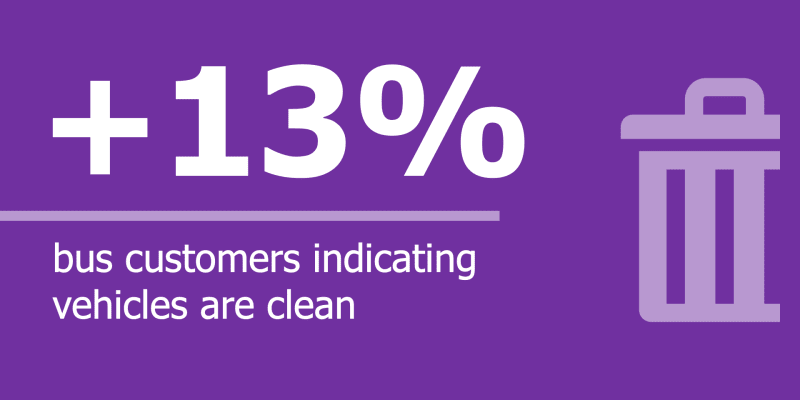 बस: सवारी साधनको सरसफाइबस ग्राहकहरूमा वर्ष-दर-वर्ष १३% वृद्धि, जसले सवारी साधनहरू सफा रहेको संकेत गर्छ
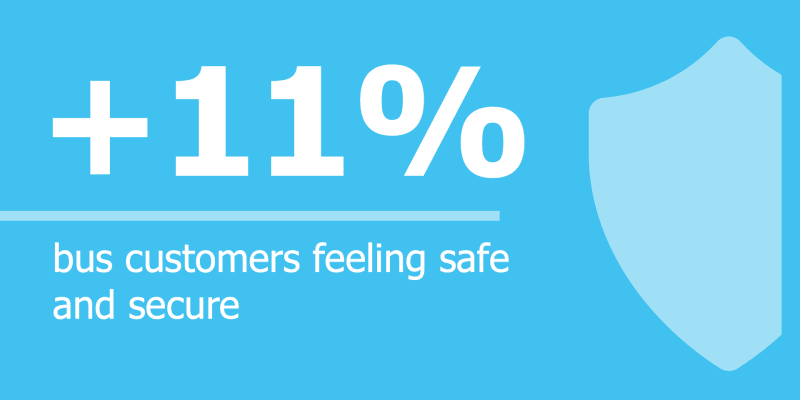 बस: सुरक्षा र सुरक्षाबस स्टपमा पर्खँदा सुरक्षित महसुस गर्ने बस ग्राहकहरूको संख्यामा वर्ष-दर-वर्ष ११% ले वृद्धि
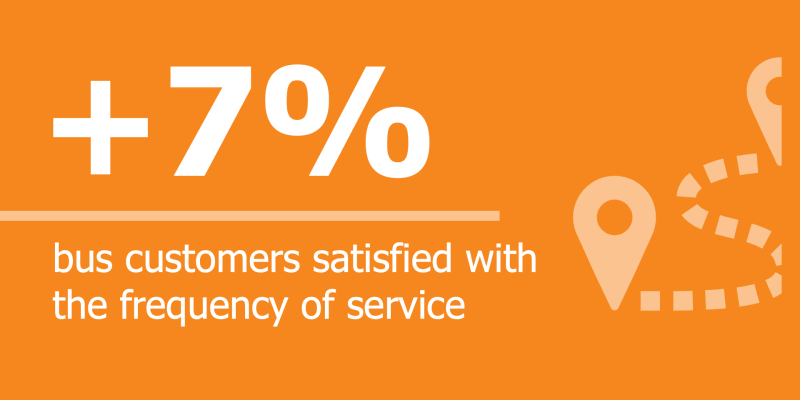 बस: सेवाको आवृत्तिसेवाको आवृत्तिसँग सन्तुष्ट वा धेरै सन्तुष्ट बस ग्राहकहरूको संख्यामा वर्ष-दर-वर्ष ७% वृद्धि
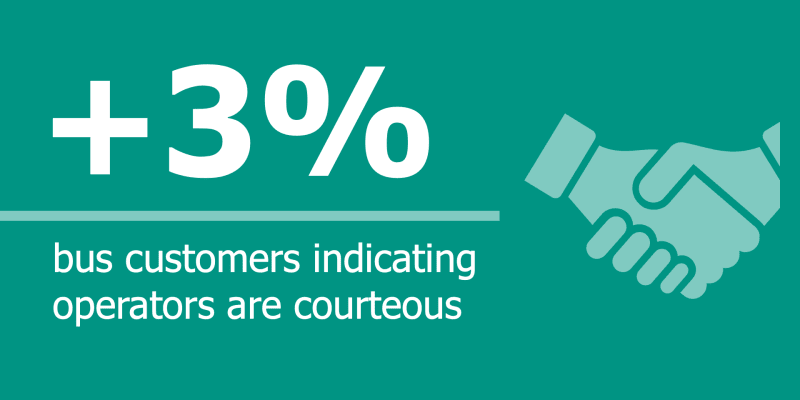 बस: अपरेटरहरूग्राहकहरूमा वर्ष-दर-वर्ष ३% वृद्धिले बस सञ्चालकहरू विनम्र रहेको संकेत गर्छबस: ग्राहकको विशेषता७८% बस ग्राहकहरू RTD को सेवाहरूमा निर्भर छन्।
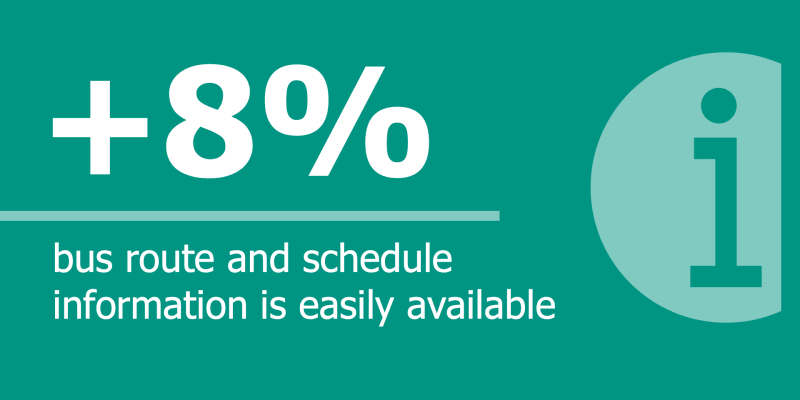 बस: जानकारीबस ग्राहकहरूमा वर्ष-दर-वर्ष ८% वृद्धिले रुट र तालिका जानकारी सजिलै उपलब्ध भएको संकेत गर्छ।
ग्राहक विशेषताहरू
जनसांख्यिकी र ट्रान्जिट प्रयोग
बस
- सम्भवतः पुरुष र १८-३९ वर्ष उमेरका
- ४२% सेतो वा कोकेशियन
- २१% हिस्पैनिक, स्पेनिश, वा ल्याटिनो/a/x
- २०% कालो/अफ्रिकी अमेरिकी
- ६३% ले घरायसी आम्दानी $५०,००० भन्दा कम भएको बताए
- ७१% ले हप्तामा तीन वा सोभन्दा बढी दिन बस सेवा प्रयोग गर्छन्
- ७८% बस सेवामा निर्भर छन्
- ५२% ले काममा जान र फर्कन बस प्रयोग गर्छन्
सन्तुष्टि र अनुकूलता
प्रदर्शन
सहमति जनाउने सर्वेक्षण उत्तरदाताहरूको प्रतिशत (सहमत वा पूर्ण सहमत)
| प्रश्न/विषय | २०२५ | २०२४ | २०२३ | राष्ट्रिय औसत | २०२५ बनाम २०२४ को तुलना |
|---|---|---|---|---|---|
| बस सामान्यतया समयमै चल्छ | ६२.२% | ५६.५% | ४८.७% | ४८% | +५.७% |
| बसले मलाई उचित समयमा मेरो गन्तव्यमा पुर्याउँछ। | ७५.३% | ७०.२% | ६५.३% | ५८% | +५.१% |
| सेवाको आवृत्ति सन्तोषजनक छ। | ६८.०% | ६१.०% | ५९.९% | ५४% | +७.०% |
व्यक्तिगत सुरक्षा र आराम
सहमति जनाउने सर्वेक्षण उत्तरदाताहरूको प्रतिशत (सहमत वा पूर्ण सहमत)
| प्रश्न/विषय | २०२५ | २०२४ | २०२३ | राष्ट्रिय औसत | २०२५ बनाम २०२४ को तुलना |
|---|---|---|---|---|---|
| बसको प्रतीक्षा गर्दा म सुरक्षित महसुस गर्छु। | ६५.८% | ५४.५% | ५६.६% | ३५% | +११.३% |
| बसमा यात्रा गर्दा म सुरक्षित महसुस गर्छु। | ७२.६% | ६१.६% | ६४.९% | ४३% | +११.०% |
| बस सफा छ। | ६७.२% | ५३.९% | ६१.७% | ३८% | +१३.३% |
पहुँच
सहमति जनाउने सर्वेक्षण उत्तरदाताहरूको प्रतिशत (सहमत वा पूर्ण सहमत)
| प्रश्न/विषय | २०२५ | २०२४ | २०२३ | राष्ट्रिय औसत | २०२५ बनाम २०२४ को तुलना |
|---|---|---|---|---|---|
| भाडाको मूल्य उचित छ। | ७६.४% | ७१.४% | ६३.९% | ६०% | ५.०% |
| बस स्टपहरू सुविधाजनक स्थानमा छन् | ७५.९% | ७४.१% | ६६.२% | ५४% | +१.८% |
सञ्चालनहरू
सहमति जनाउने सर्वेक्षण उत्तरदाताहरूको प्रतिशत (सहमत वा पूर्ण सहमत)
| प्रश्न/विषय | २०२५ | २०२४ | २०२३ | राष्ट्रिय औसत | २०२५ बनाम २०२४ को तुलना |
|---|---|---|---|---|---|
| मलाई लाग्छ बसहरू यान्त्रिक रूपमा सुरक्षित छन्। | ८८.०% | ८४.०% | ७९.०% | लागू हुँदैन | +४.० |
| मलाई चाहिने दिनहरूमा बसहरू चल्छन्। | ८१.४% | ८२.९% | ७१.५% | लागू हुँदैन | -१.५% |
| मलाई आवश्यक पर्ने समयमा बसहरू चल्छन्। | ७४.१% | ७२.०% | ६६.४% | लागू हुँदैन | +२.१% |
जानकारी
सहमति जनाउने सर्वेक्षण उत्तरदाताहरूको प्रतिशत (सहमत वा पूर्ण सहमत)
| प्रश्न/विषय | २०२५ | २०२४ | २०२३ | राष्ट्रिय औसत | २०२५ बनाम २०२४ को तुलना |
|---|---|---|---|---|---|
| बसहरू समय तालिका अनुसार चलिरहेका छन् कि छैनन् भनेर पत्ता लगाउन सजिलो छ | ६८.१% | ५७.४% | ६९.२% | ५४% | +१०.७% |
| यदि RTD ले सेवा अवरोधहरू अनुभव गर्छ भने, मलाई पर्याप्त जानकारी दिइन्छ। | ५७.४% | ४७.७% | ६३.८% | ५२% | +९.७% |
| मलाई लाग्छ कि RTD ले प्रदान गर्ने सेवाहरूको बारेमा पर्याप्त जानकारी प्रदान गरेको छ। | ८२.९% | ७२.५% | ८०.३% | लागू हुँदैन | १०.४% |
| सेवा तालिका परिवर्तनहरूको बारेमा मलाई जानकारी भएको महसुस भएको छ। | ६३.०% | ५४.६% | ६५.८% | लागू हुँदैन | +८.४% |
| मार्ग तालिका र नक्साको बारेमा जानकारी सजिलै उपलब्ध छ | ८१.१% | ७३.१% | ७५.२% | लागू हुँदैन | +८.०% |
| मार्ग तालिका र नक्सा बारे जानकारी सही छ। | ७६.७% | ६९.८% | ७२.४% | लागू हुँदैन | +६.९% |
| समग्रमा, RTD को सञ्चार सामग्री र सेवाहरू र तालिकाहरूको बारेमा जानकारी उच्च गुणस्तरको छ। | ७५.२% | ६४.२% | ७५.३% | लागू हुँदैन | +११.०% |
अपरेटर व्यवहार
सहमति जनाउने सर्वेक्षण उत्तरदाताहरूको प्रतिशत (सहमत वा पूर्ण सहमत)
| प्रश्न/विषय | २०२५ | २०२४ | २०२३ | राष्ट्रिय औसत | २०२५ बनाम २०२४ को तुलना |
|---|---|---|---|---|---|
| बस चालकहरूले सुरक्षित रूपमा गाडी चलाउँछन् | ८२.८% | ८२.५% | ७०.८% | ६९% | +०.३% |
| बस चालकहरू विनम्र छन् | ७७.४% | ७४.३% | ७०.३% | ६१% | +३.१% |
| बस चालकहरू सहयोगी छन्। | ७७.८% | ७५.४% | ६८.७% | ६०% | +२.४% |
ग्राहक सेवा
सहमति जनाउने सर्वेक्षण उत्तरदाताहरूको प्रतिशत (सहमत वा पूर्ण सहमत)
| प्रश्न/विषय | २०२५ | २०२४ | २०२३ | राष्ट्रिय औसत | २०२५ बनाम २०२४ को तुलना |
|---|---|---|---|---|---|
| मेरो प्रश्न, चिन्ता, वा गुनासो समाधान भयो। | ६३.९% | ५६.०% | ६०.९% | लागू हुँदैन | +७.९% |
| समाधान समयमै प्रदान गरिएको थियो। | ९०.०% | ९१.७% | ८९.४% | लागू हुँदैन | -१.७% |
| RTD का ग्राहक सेवा प्रतिनिधिहरू विनम्र छन्। | ७४.१% | ७१.७% | ६२.५% | लागू हुँदैन | +२.४% |
गन्तव्य र कोष
सहमति जनाउने सर्वेक्षण उत्तरदाताहरूको प्रतिशत (सहमत वा पूर्ण सहमत)
| प्रश्न/विषय | २०२५ | २०२४ | २०२३ | राष्ट्रिय औसत | २०२५ बनाम २०२४ को तुलना |
|---|---|---|---|---|---|
| RTD ले प्रमुख सार्वजनिक सेवा गन्तव्यहरूमा पहुँच प्रदान गर्दछ | ८३.६% | ८०.२% | ७४.५% | लागू हुँदैन | +३.४% |
| निजी संस्थाहरू, गैर-नाफामुखी संस्थाहरू, र स्थानीय सरकारहरूले गुणस्तर सुधार गर्न र/वा सेवाहरू विस्तार गर्न कोष बढाउने विचार गर्नुपर्छ। | ८२.९% | ८३.२% | ७६.७% | लागू हुँदैन | -०.३% |
सामुदायिक मूल्य
सहमति जनाउने सर्वेक्षण उत्तरदाताहरूको प्रतिशत (सहमत वा पूर्ण सहमत)
| प्रश्न/विषय | २०२५ | २०२४ | २०२३ | राष्ट्रिय औसत | २०२५ बनाम २०२४ को तुलना |
|---|---|---|---|---|---|
| RTD ले समुदायलाई मूल्य प्रदान गर्दछ | ८४.६% | ८४.२% | ७२.७% | ६७% | +०.४% |
रेल: सर्वेक्षण परिणामहरू
ग्राहक नेट प्रवर्द्धक स्कोर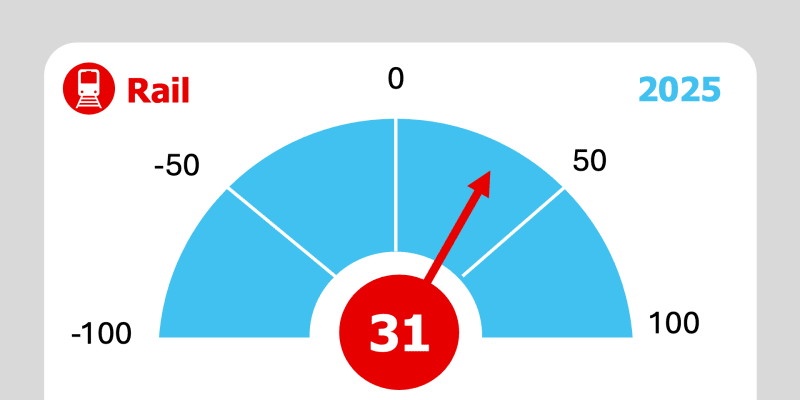 २०२५रेल एनपीएस स्कोर: +३१
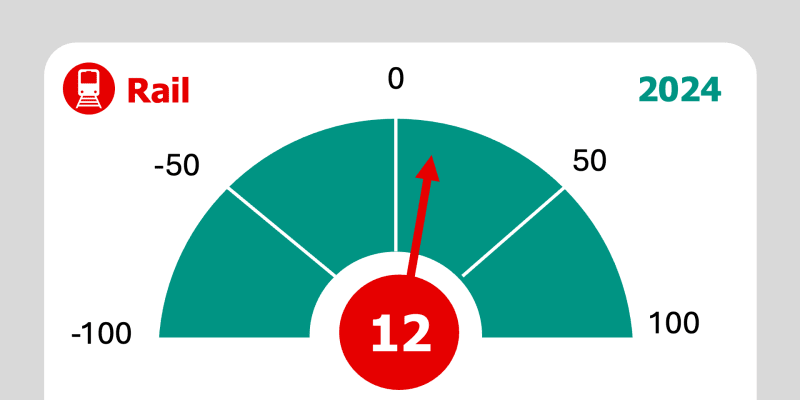 २०२४रेल एनपीएस स्कोर: +१२
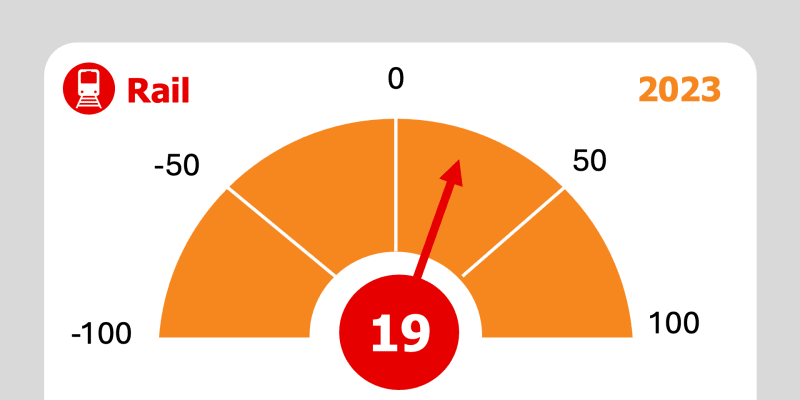 २०२३रेल एनपीएस स्कोर: +१९
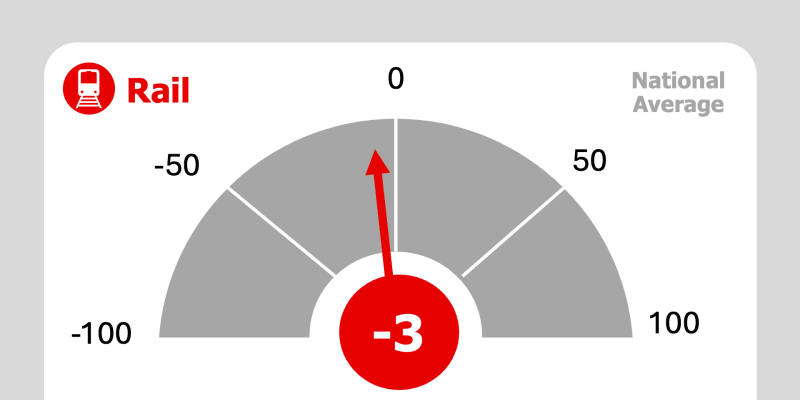 राष्ट्रिय औसतरेल एनपीएस स्कोर: -३
रेल: मुख्य टेकवे र हाइलाइटहरू
रेल: राष्ट्रिय औसत१६ सर्वेक्षण कोटीहरू मध्ये १५ मा रेलले राष्ट्रिय औसत नाघेको छ।रेल: ग्राहक विशेषता६५% रेल ग्राहकहरू RTD को सेवाहरूमा निर्भर छन्।रेल: समग्र सन्तुष्टिरेल ग्राहकहरूको समग्र सन्तुष्टिमा वर्ष-दर-वर्ष १२% वृद्धि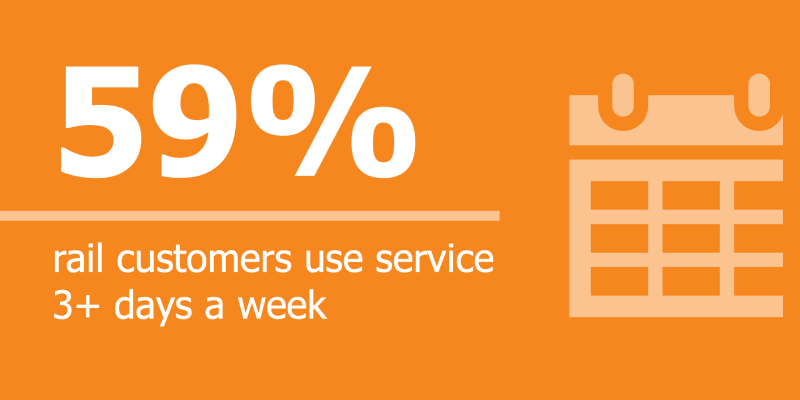 रेल: ग्राहक विशेषता५९% रेल ग्राहकहरूले हप्तामा तीन वा बढी दिन RTD को सेवाहरू प्रयोग गर्छन्।
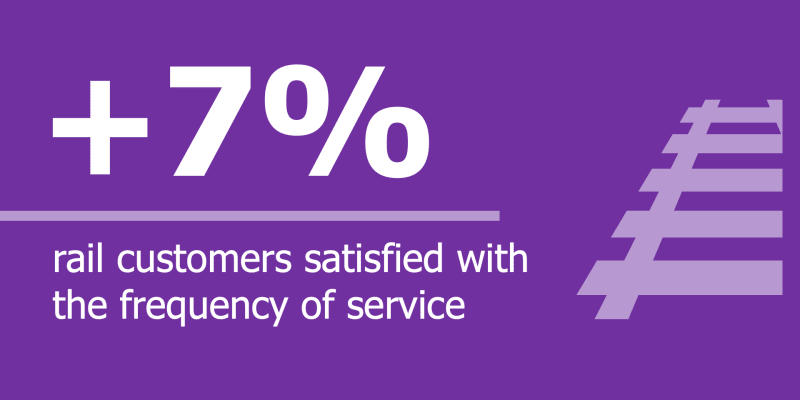 रेल: सेवाको आवृत्तिसेवाको आवृत्तिसँग सन्तुष्ट वा धेरै सन्तुष्ट रेल ग्राहकहरूको संख्यामा वर्ष-दर-वर्ष ७% वृद्धि
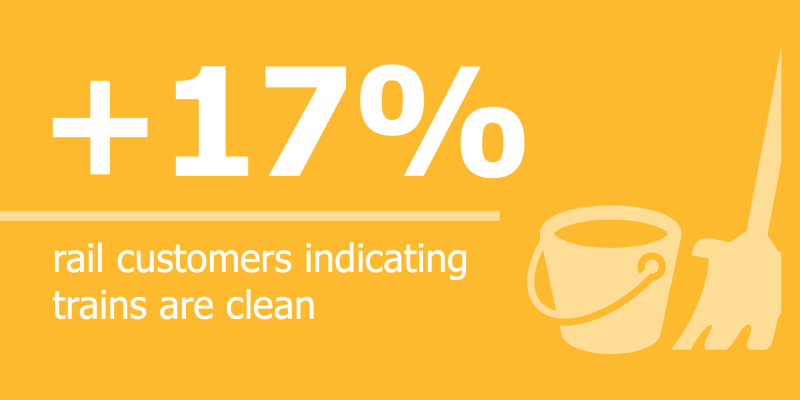 रेल: सवारी साधनको सरसफाइरेल ग्राहकहरूमा वर्ष-दर-वर्ष १७% वृद्धिले रेलहरू सफा रहेको संकेत गर्छ
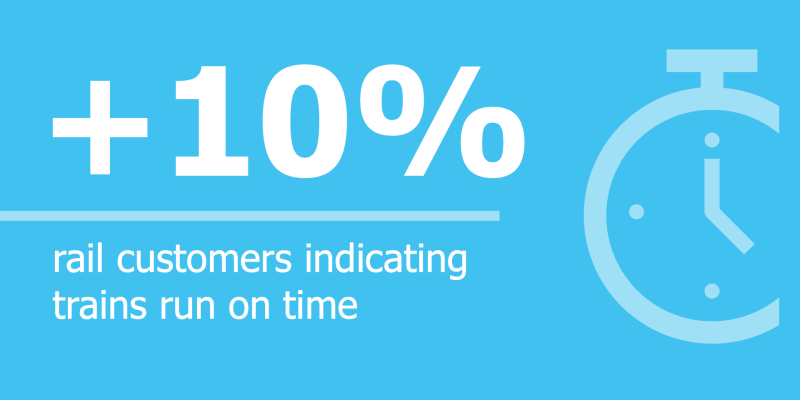 रेल: समयमै प्रदर्शनरेल ग्राहकहरूमा वर्ष-दर-वर्ष १०% वृद्धिले रेलहरू समयमै चल्ने संकेत गर्दछ
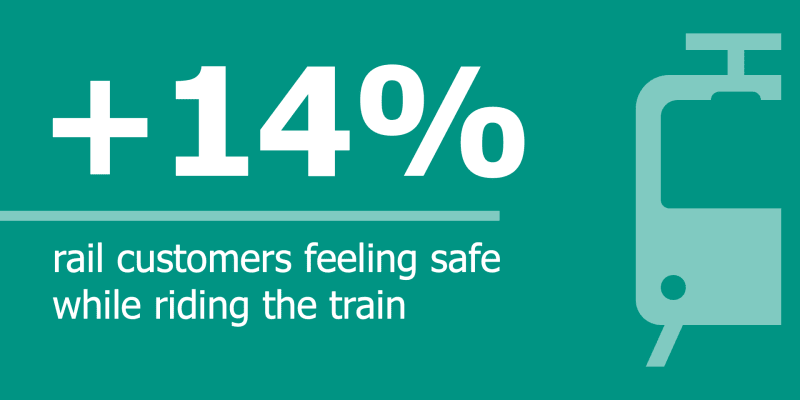 रेल: सुरक्षा र सुरक्षारेल यात्रा गर्दा सुरक्षित महसुस गर्ने रेल ग्राहकहरूको संख्यामा वर्ष-दर-वर्ष १४% ले वृद्धि
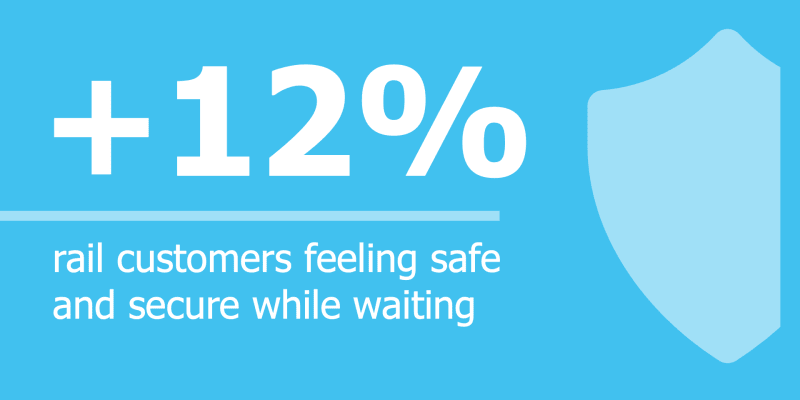 रेल: सुरक्षा र सुरक्षास्टेशनमा पर्खँदा सुरक्षित महसुस गर्ने रेल ग्राहकहरूको संख्यामा वर्ष-दर-वर्ष १२% ले वृद्धि
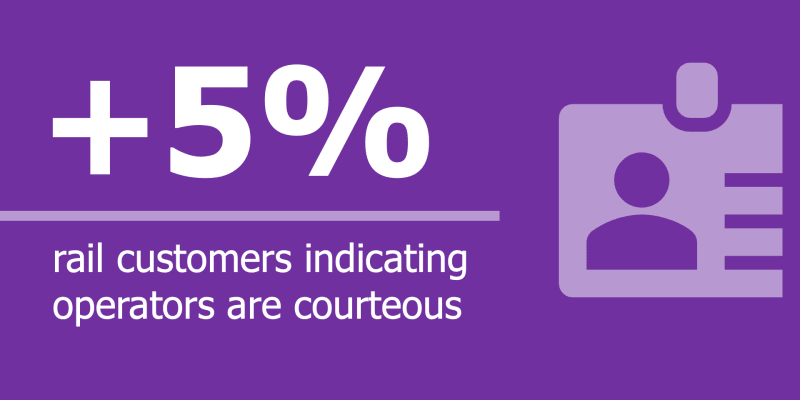 रेल: अपरेटरहरूग्राहकहरूमा वर्ष-दर-वर्ष ५% वृद्धिले रेल सञ्चालकहरू विनम्र रहेको संकेत गर्छ
ग्राहक विशेषताहरू
जनसांख्यिकी र ट्रान्जिट प्रयोग
रेल
- सम्भवतः पुरुष र १८-३९ वर्ष उमेरका
- ५०% सेतो वा कोकेशियन
- १७% हिस्पैनिक, स्पेनिश, वा ल्याटिनो/a/x
- १२% कालो/अफ्रिकी अमेरिकी
- ४०% ले घरायसी आम्दानी $५०,००० भन्दा कम भएको बताए
- ५९% ले हप्तामा तीन वा बढी दिन रेल प्रयोग गर्छन्
- ६५% रेल सेवाहरूमा निर्भर छन्
- ४८% ले काममा जान र फर्कन रेलहरू प्रयोग गर्छन्
सन्तुष्टि र अनुकूलता
प्रदर्शन
सहमति जनाउने सर्वेक्षण उत्तरदाताहरूको प्रतिशत (सहमत वा पूर्ण सहमत)
| प्रश्न/विषय | २०२५ | २०२४ | २०२३ | राष्ट्रिय औसत | २०२५ बनाम २०२४ को तुलना |
|---|---|---|---|---|---|
| रेल सामान्यतया समयमै चल्छ | ६२.७% | ५३.१% | ५३.२% | ५३% | +९.६% |
| रेलले मलाई उचित समयमा मेरो गन्तव्यमा पुर्याउँछ। | ७८.४% | ७१.५% | ६२.२% | ७१% | +६.९% |
| सेवाको आवृत्ति सन्तोषजनक छ। | ६९.७% | ६२.६% | ६१.५% | ५७% | +७.१% |
व्यक्तिगत सुरक्षा र आराम
सहमति जनाउने सर्वेक्षण उत्तरदाताहरूको प्रतिशत (सहमत वा पूर्ण सहमत)
| प्रश्न/विषय | २०२५ | २०२४ | २०२३ | राष्ट्रिय औसत | २०२५ बनाम २०२४ को तुलना |
|---|---|---|---|---|---|
| रेलको प्रतीक्षा गर्दा म सुरक्षित महसुस गर्छु। | ६७.२% | ५५.६% | ५७.७% | ३४% | +११.६% |
| म रेलमा यात्रा गर्दा सुरक्षित महसुस गर्छु। | ७५.५% | ६१.७% | ६२.६% | ४६% | +१३.८% |
| रेल सफा छ। | ७०.८% | ५४.२% | ६२.०% | ३९% | +१६.६% |
पहुँच
सहमति जनाउने सर्वेक्षण उत्तरदाताहरूको प्रतिशत (सहमत वा पूर्ण सहमत)
| प्रश्न/विषय | २०२५ | २०२४ | २०२३ | राष्ट्रिय औसत | २०२५ बनाम २०२४ को तुलना |
|---|---|---|---|---|---|
| भाडाको मूल्य उचित छ। | ७७.५% | ७६.१% | ६३.१% | ६०% | +१.४% |
| रेल स्टेशनहरू/लाइनहरू सुविधाजनक रूपमा अवस्थित छन् | ८३.३% | ७९.०% | ६९.६% | ५९% | +४.३% |
सञ्चालनहरू
सहमति जनाउने सर्वेक्षण उत्तरदाताहरूको प्रतिशत (सहमत वा पूर्ण सहमत)
| प्रश्न/विषय | २०२५ | २०२४ | २०२३ | राष्ट्रिय औसत | २०२५ बनाम २०२४ को तुलना |
|---|---|---|---|---|---|
| मलाई लाग्छ कि रेलहरू यान्त्रिक रूपमा सुरक्षित छन्। | ८९.४% | ८८.०% | ८०.०% | लागू हुँदैन | +१.४% |
| मलाई चाहिने दिनहरूमा रेलहरू चल्छन्। | ८६.५% | ८६.१% | ७६.८% | लागू हुँदैन | +०.४% |
| मलाई आवश्यक पर्ने समयमा रेलहरू चल्छन्। | ७७.५% | ७०.८% | ६६.५% | लागू हुँदैन | +६.७% |
जानकारी
सहमति जनाउने सर्वेक्षण उत्तरदाताहरूको प्रतिशत (सहमत वा पूर्ण सहमत)
| प्रश्न/विषय | २०२५ | २०२४ | २०२३ | राष्ट्रिय औसत | २०२५ बनाम २०२४ को तुलना |
|---|---|---|---|---|---|
| रेलहरू समय तालिका अनुसार चलिरहेका छन् कि छैनन् भनेर पत्ता लगाउन सजिलो छ | ६६.०% | ५९.९% | ६१.९% | ५६% | +६.१% |
| यदि RTD ले सेवा अवरोधहरू अनुभव गर्छ भने, मलाई पर्याप्त जानकारी दिइन्छ। | ५५.६% | ५०.९% | ५६.१% | ६०% | +४.७% |
| मलाई लाग्छ कि RTD ले प्रदान गर्ने सेवाहरूको बारेमा पर्याप्त जानकारी प्रदान गरेको छ। | ८३.८% | ७४.४% | ७९.९% | लागू हुँदैन | +९.५% |
| सेवा तालिका परिवर्तनहरूको बारेमा मलाई जानकारी भएको महसुस भएको छ। | ६२.५% | ५४.८% | ५९.७% | लागू हुँदैन | +७.८% |
| मार्ग तालिका र नक्साको बारेमा जानकारी सजिलै उपलब्ध छ | ७९.६% | ७७.९% | ७३.८% | लागू हुँदैन | +१.७% |
| मार्ग तालिका र नक्सा बारे जानकारी सही छ। | ७८.६% | ७२.१% | ७१.०% | लागू हुँदैन | +६.५% |
| समग्रमा, RTD को सञ्चार सामग्री र सेवाहरू र तालिकाहरूको बारेमा जानकारी उच्च गुणस्तरको छ। | ७३.७% | ६७.१% | ७०.२% | लागू हुँदैन | +६.६% |
अपरेटर व्यवहार
सहमति जनाउने सर्वेक्षण उत्तरदाताहरूको प्रतिशत (सहमत वा पूर्ण सहमत)
| प्रश्न/विषय | २०२५ | २०२४ | २०२३ | राष्ट्रिय औसत | २०२५ बनाम २०२४ को तुलना |
|---|---|---|---|---|---|
| रेल चालकहरूले सुरक्षित रूपमा गाडी चलाउँछन् | ८६.२% | ८५.१% | ७८.१% | ७२% | +१.१% |
| रेल चालकहरू विनम्र छन् | ८४.९% | ८०.४% | ७३.२% | ५७% | +४.५% |
| रेल चालकहरू सहयोगी हुन्छन् | ८२.१% | ७७.३% | ७३.२% | ६१% | +४.८% |
ग्राहक सेवा
सहमति जनाउने सर्वेक्षण उत्तरदाताहरूको प्रतिशत (सहमत वा पूर्ण सहमत)
| प्रश्न/विषय | २०२५ | २०२४ | २०२३ | राष्ट्रिय औसत | २०२५ बनाम २०२४ को तुलना |
|---|---|---|---|---|---|
| मेरो प्रश्न, चिन्ता, वा गुनासो समाधान भयो। | ६१.६% | ५६.९% | ५८.६% | लागू हुँदैन | +४.८% |
| समाधान समयमै प्रदान गरिएको थियो। | ८४.१% | ९३.२% | ९२.७% | लागू हुँदैन | -९.१% |
| RTD का ग्राहक सेवा प्रतिनिधिहरू विनम्र छन्। | ६८.४% | ६९.६% | ६६.०% | लागू हुँदैन | -१.२% |
गन्तव्य र कोष
सहमति जनाउने सर्वेक्षण उत्तरदाताहरूको प्रतिशत (सहमत वा पूर्ण सहमत)
| प्रश्न/विषय | २०२५ | २०२४ | २०२३ | राष्ट्रिय औसत | २०२५ बनाम २०२४ को तुलना |
|---|---|---|---|---|---|
| RTD ले प्रमुख सार्वजनिक सेवा गन्तव्यहरूमा पहुँच प्रदान गर्दछ | ८५.५% | ८४.३% | ७५.८% | लागू हुँदैन | +१.२% |
| निजी संस्थाहरू, गैर-नाफामुखी संस्थाहरू, र स्थानीय सरकारहरूले गुणस्तर सुधार गर्न र/वा सेवाहरू विस्तार गर्न कोष बढाउने विचार गर्नुपर्छ। | ८४.४% | ८८.६% | ७५.८% | लागू हुँदैन | -४.३% |
सामुदायिक मूल्य
सहमति जनाउने सर्वेक्षण उत्तरदाताहरूको प्रतिशत (सहमत वा पूर्ण सहमत)
| प्रश्न/विषय | २०२५ | २०२४ | २०२३ | राष्ट्रिय औसत | २०२५ बनाम २०२४ को तुलना |
|---|---|---|---|---|---|
| RTD ले समुदायलाई मूल्य प्रदान गर्दछ | ८६.६% | ८५.०% | ७९.०% | ७३% | +१.६% |
प्याराट्रान्जिट: सर्वेक्षण परिणामहरू
ग्राहक नेट प्रवर्द्धक स्कोर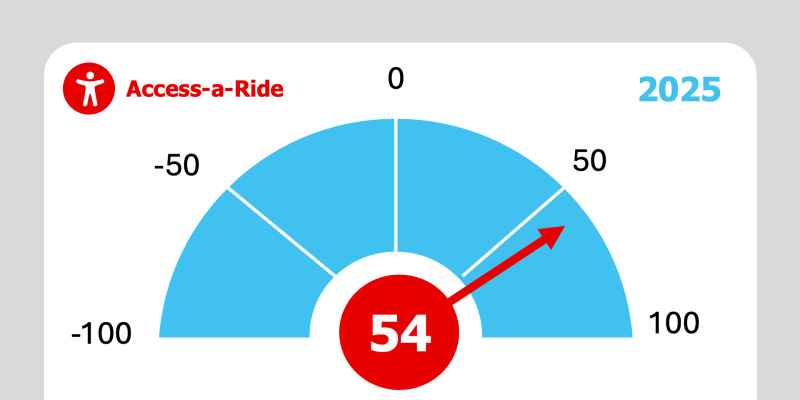 २०२५एक्सेस-ए-राइड एनपीएस स्कोर: +५४
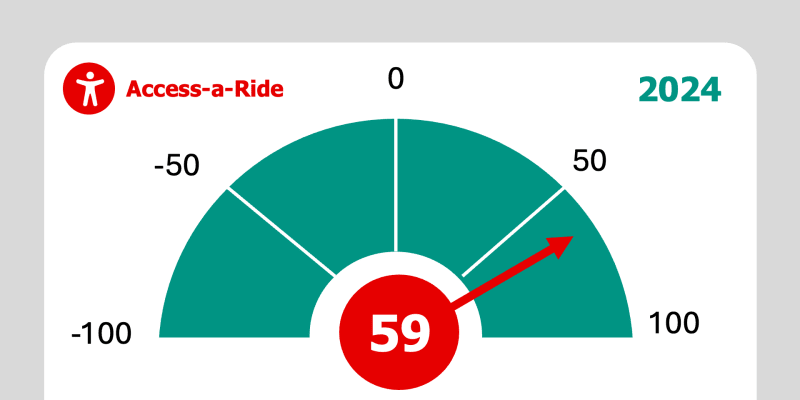 २०२४एक्सेस-ए-राइड एनपीएस स्कोर: +५९
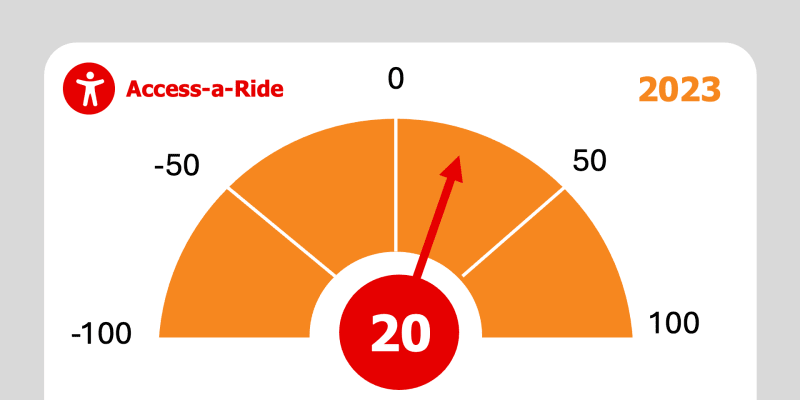 २०२३एक्सेस-ए-राइड एनपीएस स्कोर: +२०
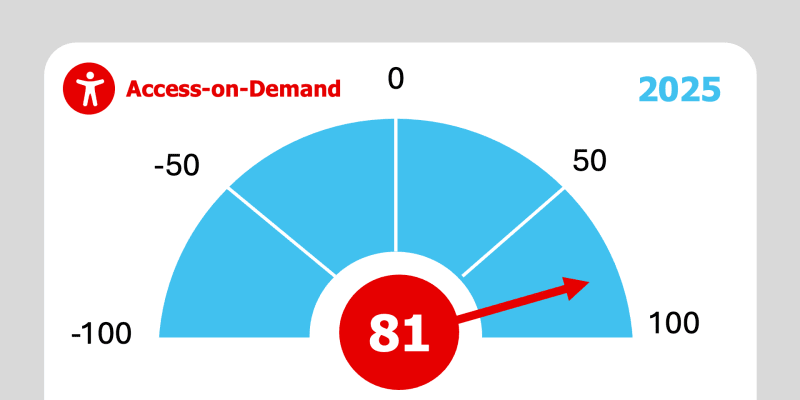 २०२५माग अनुसार पहुँच NPS स्कोर: +८१
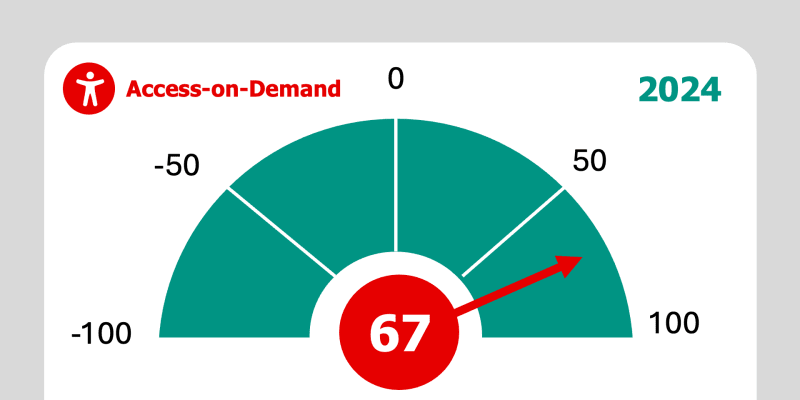 २०२४माग अनुसार पहुँच NPS स्कोर: +६७
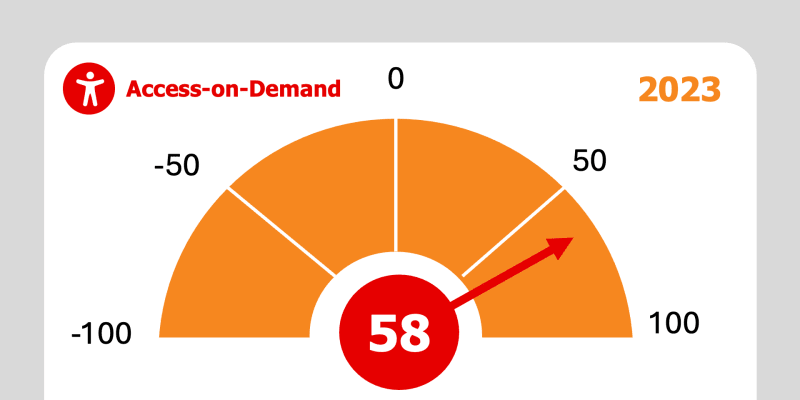 २०२३माग अनुसार पहुँच NPS स्कोर: +५८
ग्राहक विशेषताहरू
जनसांख्यिकी र ट्रान्जिट प्रयोग
प्याराट्रान्जिट
- महिला र ६५ वर्षभन्दा माथिको हुने सम्भावना बढी हुन्छ
- AaR:६४% AoD:६६% सेतो वा कोकेशियन
- AaR:१६% AoD:१२% हिस्पैनिक, स्पेनिश, वा ल्याटिनो/a/x
- AaR: १८% AoD: १५% कालो/अफ्रिकी अमेरिकी
- AaR:८६% AoD:९०% ले $५०,००० भन्दा कम घरायसी आम्दानी रिपोर्ट गरेको छ
- AaR: सर्वेक्षण गरिएका ५२% प्रयोगकर्ताहरूले आफ्नो धेरैजसो यात्राहरूमा AaR प्रयोग गर्छन्।
- AaR: ४१% ले मेडिकल अपोइन्टमेन्टको लागि सेवाहरू प्रयोग गर्छन्
- AoD: सर्वेक्षण गरिएका ७४% प्रयोगकर्ताहरूले आफ्नो अधिकांश यात्राहरू गर्न AoD प्रयोग गर्छन्
- AoD: ४५% ले मेडिकल अपोइन्टमेन्टको लागि सेवाहरू प्रयोग गर्छन्
वर्ष: एक्सेस-ए-राइड
एओडी: माग अनुसार पहुँच
सन्तुष्टि र अनुकूलता
समग्र सन्तुष्टि
सन्तुष्टि जनाउने सर्वेक्षण उत्तरदाताहरूको प्रतिशत (सन्तुष्ट वा धेरै सन्तुष्ट)
| प्रश्न/विषय | २०२५ | २०२४ | २०२३ | राष्ट्रिय औसत | २०२५ बनाम २०२४ को तुलना |
|---|---|---|---|---|---|
| एक्सेस-ए-राइड | ८४% | ८०% | लागू हुँदैन | +४% | |
| माग अनुसार पहुँच | ९७% | ८६% | +११% |

सामुदायिक मूल्य सर्वेक्षण
ग्राहकहरूबाट प्रत्यक्ष प्रतिक्रिया सङ्कलन गर्नुको साथै, RTD ले डेनभर मेट्रो क्षेत्रभरि घरपरिवारबाट छुट्टै प्रतिक्रिया पनि माग्यो।
समुदाय: सर्वेक्षण परिणामहरू
सामुदायिक नेट प्रमोटर स्कोर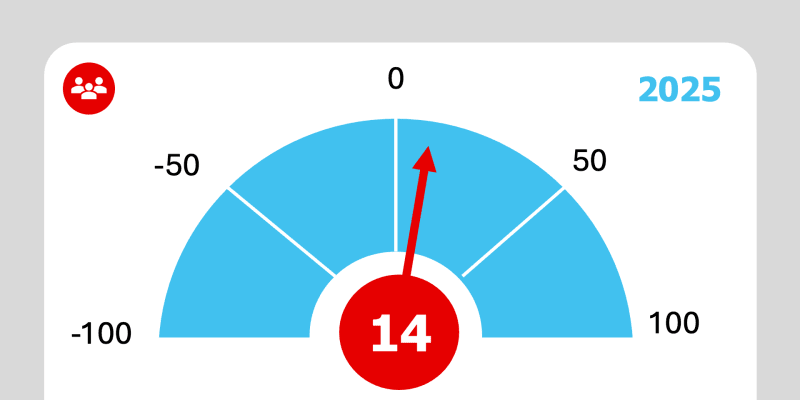 २०२५सामुदायिक NPS स्कोर: +१४
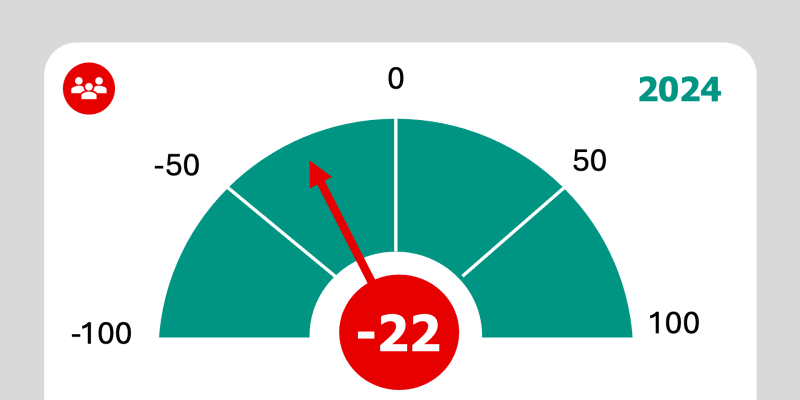 २०२४सामुदायिक NPS स्कोर: -२२
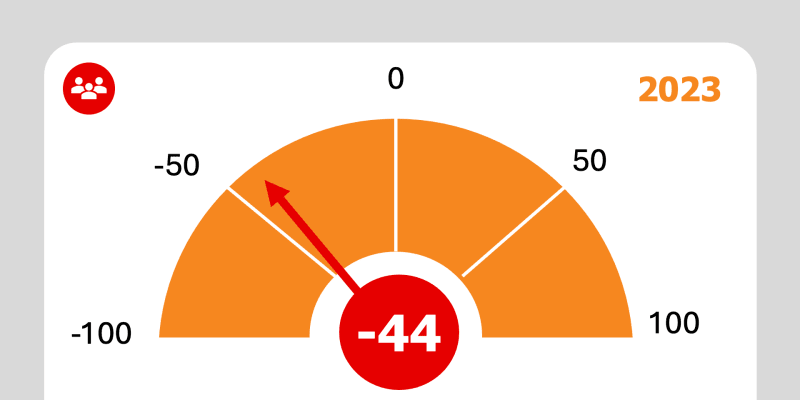 २०२३सामुदायिक NPS स्कोर: -४४
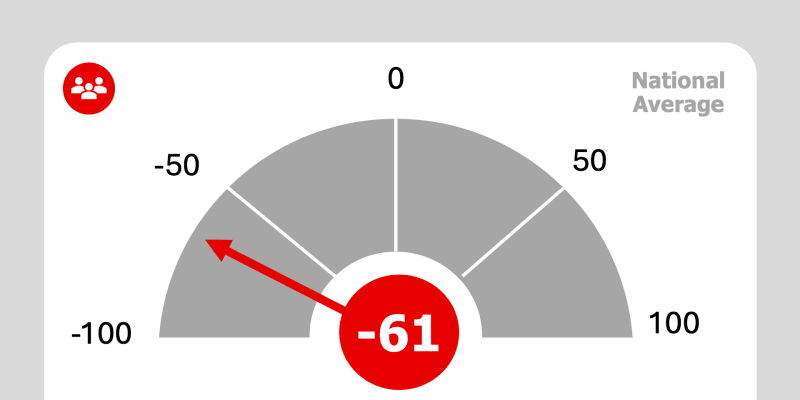 राष्ट्रिय औसतसामुदायिक NPS स्कोर: -६१
RTD को मूल्य
मूल्यको धारणा
मूल्यवान वा अत्यन्तै मूल्यवान संकेत गर्ने सर्वेक्षण उत्तरदाताहरूको प्रतिशत
| प्रश्न/विषय | २०२५ | २०२४ | २०२३ | राष्ट्रिय औसत | २०२५ बनाम २०२४ को तुलना |
|---|---|---|---|---|---|
| ग्रेटर डेन्भर क्षेत्रको लागि मूल्य | ८६% | ८६% | ८४% | ६६% | +०% |
| तपाईंको लागि व्यक्तिगत रूपमा मूल्य | ७३% | ६२% | ५४% | ३१% | +११% |
| विशेष गतिशीलता आवश्यकता भएका मानिसहरूलाई यातायात विकल्पहरू प्रदान गर्दै | ८८% | ८८% | ८२% | ७८% | +०% |
| किफायती यातायात विकल्पहरू प्रदान गर्दै | ८२% | ८०% | ७८% | ७७% | +२% |
| जीवनको गुणस्तर सुधार गर्दै | ७६% | ७५% | ६६% | ५६% | +१% |
| यस क्षेत्रमा थप रोजगारीका अवसरहरू आकर्षित गर्ने र कायम राख्ने | ६४% | ६५% | ६२% | ५४% | -१% |
| ट्राफिक जाम कम गर्दै | ८०% | ७८% | ७५% | ५६% | +२% |
| सबै प्रयोगकर्ताहरूको लागि सडकहरू सुरक्षित बनाउने | ७४% | ७३% | ६८% | ४५% | +१% |
| रोजगारीका ठाउँहरूमा पहुँच प्रदान गर्ने | ७७% | ७३% | ६८% | ६९% | +४% |
| चिकित्सा सुविधाहरूमा पहुँच प्रदान गर्दै | ६९% | ६९% | ६२% | ७७% | +०% |
| शैक्षिक सुविधाहरूमा पहुँच प्रदान गर्दै | ७८% | ८१% | ७५% | ७२% | -३% |
| फुर्सदका ठाउँहरूमा पहुँच प्रदान गर्दै | ७६% | ७७% | ७३% | ५७% | -१% |
| दिगो अभ्यासहरू प्राप्त गर्दै, प्रदूषण र कार्बन फुटप्रिन्ट कम गर्दै | ८३% | ८३% | ८२% | ५८% | +०% |
| सुरक्षित यातायातको विकल्प प्रदान गर्दै | ८१% | ७७% | ७३% | ७४% | +४% |
| क्षेत्र, छेउछाउका शहरहरू र काउन्टीहरूमा पहुँच प्रदान गर्दै | ६९% | ७१% | ६१% | ६९% | -२% |
| सामुदायिक व्यवसायलाई सहयोग गर्दै | ६८% | ७२% | ६४% | लागू हुँदैन | -४% |
| किफायती आवास खोज्ने अवसरहरू प्रदान गर्दै | ६३% | ६३% | ५३% | लागू हुँदैन | +०% |
सेवा-सम्बन्धित अनुकूलता
अनुकूलताको धारणा
सहमति जनाउने सर्वेक्षण उत्तरदाताहरूको प्रतिशत (सहमत वा पूर्ण सहमत)
| प्रश्न/विषय | २०२५ | २०२४ | २०२३ | राष्ट्रिय औसत | २०२५ बनाम २०२४ को तुलना |
|---|---|---|---|---|---|
| मलाई RTD ब्रान्डको बारेमा सकारात्मक धारणा छ। | ४८% | ४६% | ४४% | ४५% | +२% |
| RTD सेवाहरू प्रयोग गर्दा म व्यक्तिगत रूपमा सुरक्षित महसुस गर्छु। | ४६% | ४३% | ४०% | ५५% | +३% |
| RTD ले रोजगार केन्द्रहरूलाई पर्याप्त रूपमा सेवा दिन्छ | ४४% | ३६% | ३६% | ३२% | +८% |
| RTD को वित्तीय प्रतिवेदन बुझ्ने र पारदर्शी छ। | २७% | २५% | २०% | २२% | +२% |
| मलाई लाग्छ कि RTD सवारी साधनहरू यान्त्रिक रूपमा सुरक्षित छन्। | ९०% | ८५% | ८८% | ५५% | +५% |
| विभिन्न अपाङ्गता भएका व्यक्तिहरूको लागि RTD सेवाहरू पहुँचयोग्य छन् | ७६% | ७२% | ७४% | ४२% | +४% |
| RTD एक विविध, समतामूलक, र समावेशी सामुदायिक स्रोत हो | ७१% | ६३% | ६१% | लागू हुँदैन | +८% |
| RTD सेवाले सामुदायिक व्यवसायलाई समर्थन गर्दछ | ५२% | ४८% | ४५% | लागू हुँदैन | +४% |
| समुदायको पारवहनमा लगानीले मूल्य प्रदान गर्दछ | ८२% | ८१% | ८०% | लागू हुँदैन | +१% |
| RTD विश्वसनीय छ | ४४% | ४०% | ३७% | ५५% | +४% |
| RTD सार्वजनिक कोषको राम्रो प्रबन्धक हो। | ३३% | २९% | २७% | लागू हुँदैन | +४% |
| आरटीडीले आफ्नो वित्तीय स्रोतहरू राम्रोसँग व्यवस्थापन गर्छ। | २१% | १९% | १४% | लागू हुँदैन | +२% |