የደንበኛ እና የማህበረሰብ ጥናቶች
ውጤቶች፣ ቁልፍ ነጥቦች እና ዋና ዋና ነጥቦች
በRTD፣ ከደንበኞቻችን እና ከምንገለግላቸው ማህበረሰቦች ጋር መገናኘት ፍላጎቶችን፣ ግምቶችን እና ልምዶችን በተሻለ ሁኔታ እንድንረዳ ያስችለናል። ከደንበኞቻችን እና ከማህበረሰቡ ጋር የምንገናኝበት አንዱ መንገድ የኤጀንሲውን አፈጻጸም ለመለካት ዓመታዊ የዳሰሳ ጥናቶችን በማድረግ ነው።
የ2025 ዓ.ም. የደንበኛ ልቀት ጥናት እና የማህበረሰብ እሴት ጥናት ምን በጥሩ ሁኔታ እየሰራ እንደሆነ እና ተጨማሪ ማሻሻያዎች የት እንደሚያስፈልጉ ግንዛቤዎችን ይሰጠናል። ይህንን መረጃ በጥንቃቄ መገምገም አዝማሚያዎችን ለመለየት፣ ስጋቶችን ለመፍታት እና በኦፕሬሽኖች እና አገልግሎቶች ላይ በመረጃ ላይ የተመሰረቱ ማሻሻያዎችን ለማድረግ ያስችለናል። ይህ ሂደት RTD ቅልጥፍናን እና የደንበኛ እርካታን ለማሻሻል ብቻ ሳይሆን ለማዳመጥ እና ቀጣይነት ያለው መሻሻል ቁርጠኝነትን በማሳየት እምነትን እና ግልጽነትን ያበረታታል። ስለ የዳሰሳ ጥናቱ ውጤቶች የበለጠ ለማንበብ፣ የRTD የዜና ማቆሚያ ገጽን ይጎብኙ.
በዚህ ገጽ ላይ፦

የዳሰሳ ጥናቶች አጠቃላይ እይታ

ለአምስተኛ ተከታታይ ዓመት፣ RTD የኤጀንሲውን ጥንካሬዎች በተሻለ ሁኔታ ለመረዳት እንዲሁም የማሻሻያ እድሎችን ለመለየት ደንበኞቹን እና ማህበረሰቡን ሲቃኝ ቆይቷል።
RTD እንደገና ከ ጋር ውል ፈርሟል የኢ.ቲ.ሲ. ተቋም, ብሄራዊ፣ የሶስተኛ ወገን የምርምር ድርጅት፣ በ2025 አመታዊ የዳሰሳ ጥናቱን ያካሂዳል። የETC ተቋም ለመንግስት ኤጀንሲዎች፣ ለትርፍ ያልተቋቋሙ እና ለህዝብ አገልግሎት ድርጅቶች በማህበረሰብ፣ በመጓጓዣ፣ በሕዝብ ደህንነት እና በሌሎች የውጪ የዳሰሳ ጥናቶች ላይ የተካነ ነው። የETC ተቋም በ1,000 ማህበረሰቦች ውስጥ ከ3.2 ሚሊዮን በላይ የዳሰሳ ጥናቶችን አካሂዷል፣ ይህም ለብሔራዊ የመለኪያ መረጃ እና መለኪያዎች ደረጃውን አስቀምጧል።
የምርምር ድርጅቱ የአስርተ ዓመታት ልምድ የአካባቢ መንግስታት እና የመንግስት ተቋማት በባለሙያዎች የተነደፉ የዳሰሳ ጥናቶች፣ ጠንካራ የመረጃ ትንተና እና አስተዋይ ዘገባዎችን በመጠቀም የህዝብን ስሜት በተሻለ ሁኔታ እንዲረዱ ያግዛል።
ዘዴ እና የመተማመን ክፍተቶች
የታዳሚዎች፣ የመሰብሰቢያ ጊዜ እና የዳሰሳ ጥናት ዘዴ
በሚያዝያ 2025፣ የደንበኞቹን እና የማህበረሰቡን ግንዛቤ፣ አመለካከት፣ ልምዶች እና አስተያየቶች በተሻለ ለመረዳት አራት የተለያዩ በስታቲስቲክስ ደረጃ ተቀባይነት ያላቸው ጥናቶች ተካሂደዋል።
| የዳሰሳ ጥናት | ታዳሚዎች | የመሰብሰቢያ ጊዜ | ዘዴ | የተጠናቀቁ የዳሰሳ ጥናቶች | የመተማመን ክፍተት |
|---|---|---|---|---|---|
| የማህበረሰብ እሴት | የሜትሮ አካባቢ ቤተሰቦች፣ ከስነሕዝብ ብዛት ጋር ተመጣጣኝ | ኤፕሪል 2025 | ደብዳቤ፣ ኢሜይል እና ጽሑፍ | 770 | +/- 3.8% በ95% በራስ መተማመን ደረጃ |
| የደንበኛ ብቃት፡ አውቶቡስ | ሁሉም የአውቶቡስ መስመሮች፣ ከ2025 የጸደይ ወቅት ቦርዲንግ ጋር ተመጣጣኝ | ኤፕሪል 2025 | የደንበኛ ጣልቃ ገብነት | 1,063 | +/- 2.8% በ95% በራስ መተማመን ደረጃ |
| የደንበኛ ልቀት፡ የባቡር ሐዲድ | ሁሉም የባቡር መስመሮች፣ ከ2025 የጸደይ ወራት ቦርዲንግ ጋር ተመጣጣኝ | ኤፕሪል 2025 | የደንበኛ ጣልቃ ገብነት | 758 | +/- 2.8% በ95% በራስ መተማመን ደረጃ |
| የደንበኛ ልቀት፡ ፓራትራንስት | የተመዘገቡ የፓራትራንስ ደንበኞች | ኤፕሪል 2025 | ደብዳቤ፣ ኢሜይል እና ጽሑፍ | 444 | +/- 4.9% በ95% በራስ መተማመን ደረጃ |
የደንበኛ ጣልቃ ገብነት ዘዴ
የአውቶቡስ እና የባቡር ሀዲድ ጥናቶች የተካሄዱት በ የደንበኛ ጣልቃ ገብነት ዘዴይህም ተመራማሪዎች የRTD አገልግሎቶችን ከሚጠቀሙ ግለሰቦች ፈጣን፣ በእውነተኛ ጊዜ ግብረመልስ እንዲሰበስቡ አስችሏቸዋል። ይህ የዳሰሳ ጥናት ዘዴ ግብረ መልስ በእውነተኛ ደንበኞች መሰጠቱን ያረጋግጣል፣ እና የተሰበሰበው መረጃ ከተወሰኑ የአውቶቡስ መስመሮች፣ የባቡር መስመሮች እና የመጓጓዣ አገልግሎቶች ጋር ተመጣጣኝ ነው።
የመተማመን ክፍተቶች
የ በራስ መተማመን ክፍተት በዳሰሳ ጥናቱ መረጃ ላይ በመመስረት የመላው ህዝብ ትክክለኛ ምላሾች የሚቀንሱበትን ክልል ያመለክታል። የRTD ጥናቶች በ95% በራስ መተማመን ደረጃ ይገለፃሉ፣ ይህም ማለት ተመሳሳይ ትክክለኛ ጥናት 100 ጊዜ ከተሰራ ውጤቶቹ በዚያ ክልል ውስጥ 95 ጊዜ ይወድቃሉ ማለት ነው። ይህም የዳሰሳ ጥናቱ ውጤቶች በስታቲስቲክስ ትክክለኛ እና የሁሉም ደንበኞች እና የማህበረሰቡ ተወካዮች መሆናቸውን ለማረጋገጥ ይረዳል።
የኢቲሲ ኢንስቲትዩት ብሔራዊ የንጽጽር ትራንስፖርት መረጃ የተሰበሰበው በመላ አገሪቱ በመቶዎች በሚቆጠሩ ከተሞች ከሚካሄዱ የቤተሰብ ጥናቶች ነው።
ቁልፍ ነጥቦች እና ዋና ዋና ነጥቦች
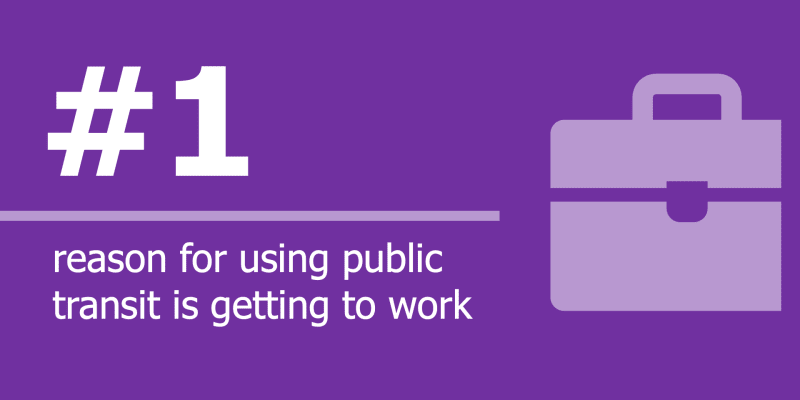 የመጓጓዣ አጠቃቀምወደ ሥራ መግባት ሰዎች የRTD የአውቶቡስ እና የባቡር አገልግሎቶችን የሚጠቀሙበት #1 ምክንያት ሲሆን ይህም ከ2024 ጋር ሲነጻጸር በ7% ጨምሯል
 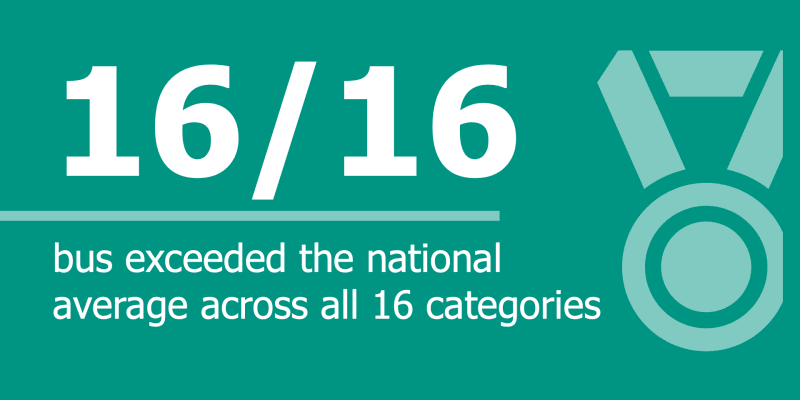 አውቶቡስ፡ ብሔራዊ አማካይአውቶቡሱ በሁሉም 16 የዳሰሳ ጥናት ምድቦች ውስጥ ከአገር አቀፍ አማካይ በልጧል
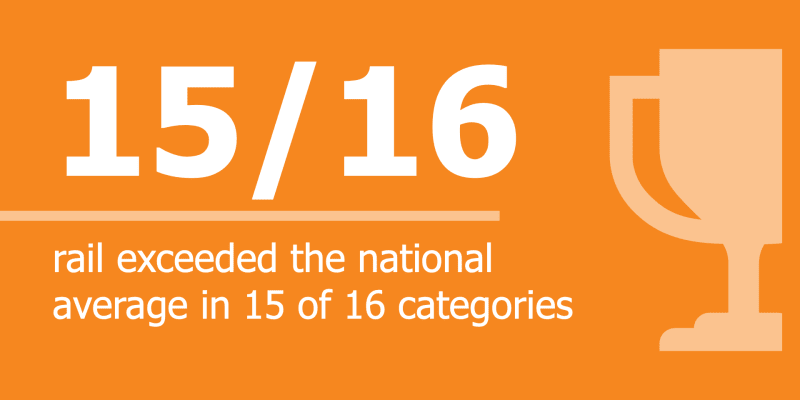 የባቡር ሐዲድ፡ ብሔራዊ አማካይየባቡር መስመር ከ16ቱ የዳሰሳ ጥናት ምድቦች ውስጥ በ15ቱ ውስጥ ከአገር አቀፍ አማካይ በልጧል
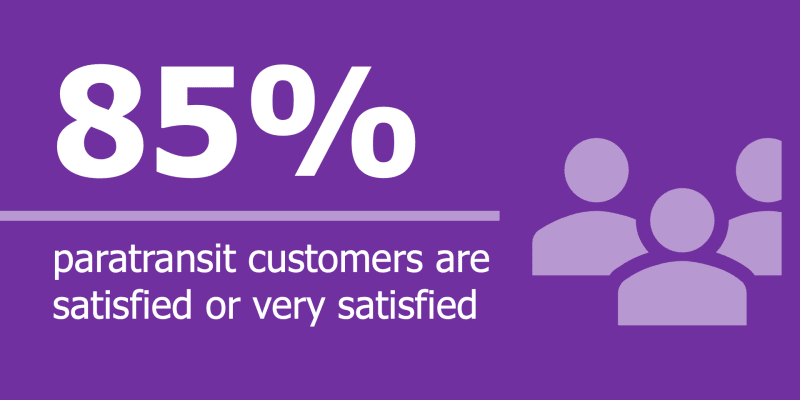 ፓራትራንስት፡ አጠቃላይ እርካታ85% የሚሆኑ የፓራትራንስት ደንበኞች በRTD አገልግሎቶች ረክተዋል ወይም በጣም ረክተዋል
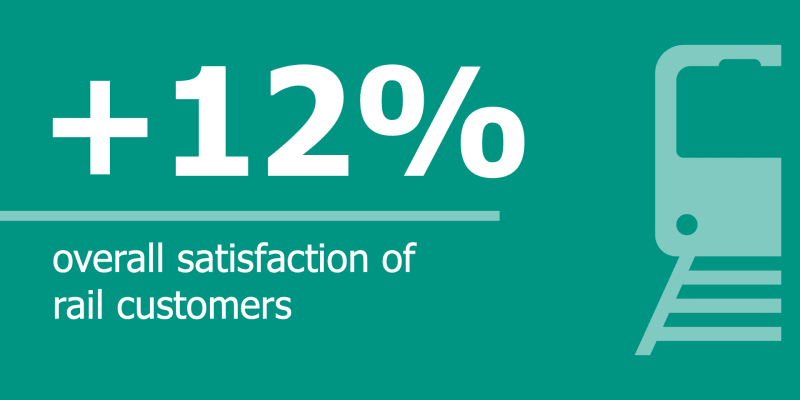 የባቡር ሐዲድ፡ አጠቃላይ እርካታየባቡር ደንበኞች አጠቃላይ እርካታ ከዓመት ወደ ዓመት 12% ጭማሪ አሳይቷል
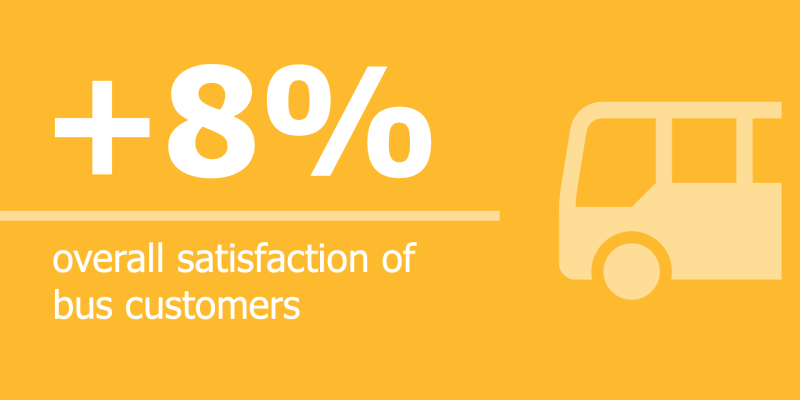 አውቶቡስ፡ አጠቃላይ እርካታየአውቶቡስ ደንበኞች አጠቃላይ እርካታ ከዓመት ወደ ዓመት 8% ጭማሪ አሳይቷል
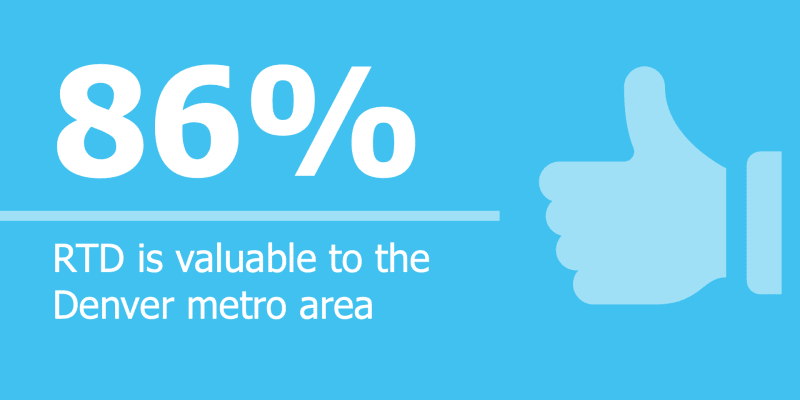 ማህበረሰብ፡ የRTD እሴት86% የሚሆነው የማህበረሰቡ ክፍል RTD ለዴንቨር ሜትሮ አካባቢ ዋጋ እንደሚሰጥ ያምናሉ
 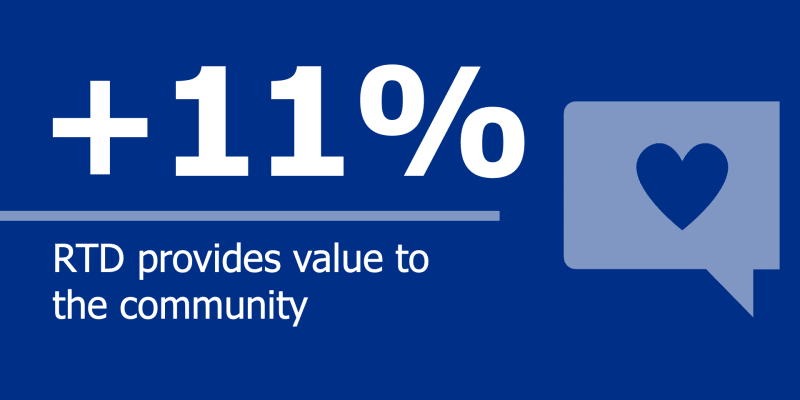 ማህበረሰብ፡ የRTD እሴትበማህበረሰቡ ውስጥ ከዓመት ወደ ዓመት 11% ጭማሪ እንደሚያሳይ RTD እሴት ይሰጣል
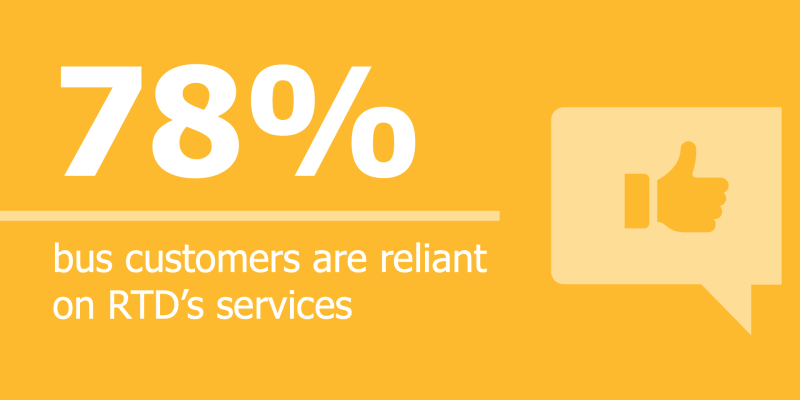 አውቶቡስ፡ የደንበኛ ባህሪ78% የሚሆኑ የአውቶቡስ ደንበኞች በRTD አገልግሎቶች ላይ ጥገኛ ናቸው
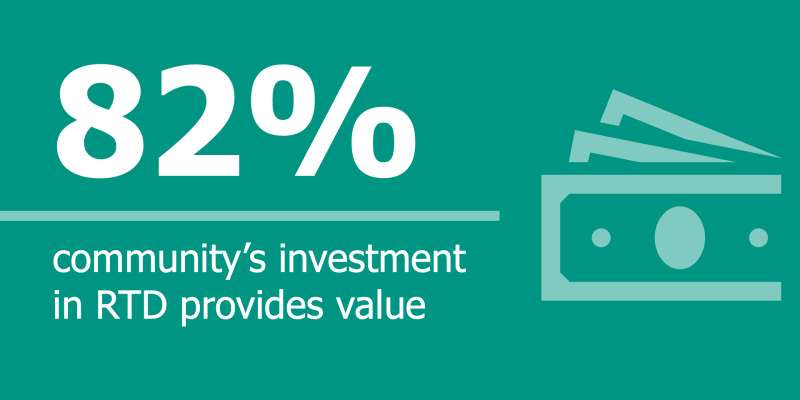 ማህበረሰብ፡ የRTD እሴት82% የሚሆነው የማህበረሰቡ ክፍል በRTD ላይ የሚያደርጉት ኢንቨስትመንት ዋጋ እንደሚያስገኝ ያምናሉ
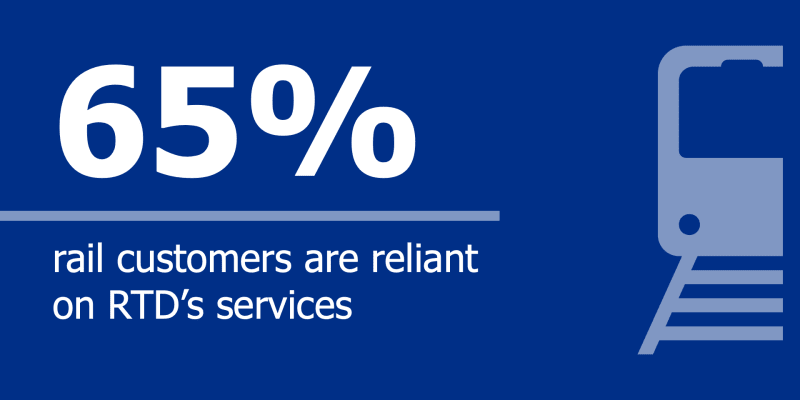 የባቡር ሐዲድ፡ የደንበኛ ባህሪ65% የሚሆኑ የባቡር ደንበኞች በRTD አገልግሎቶች ላይ ጥገኛ ናቸው
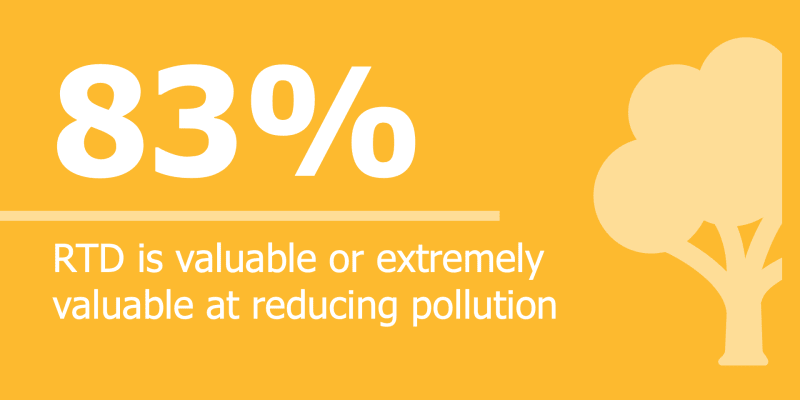 ማህበረሰብ፡ ብክለትን መቀነስ83% የሚሆነው የማህበረሰቡ ክፍል የአየር ንብረት ለውጥ (RTD) ብክለትን ለመቀነስ እና ዘላቂ የሆኑ ልምዶችን ለማሳካት ጠቃሚ ወይም እጅግ በጣም ጠቃሚ እንደሆነ ያምናሉ።
| 2025 | 2024 | 2023 | የ2025 እና የ2024 ንፅፅር | |
|---|---|---|---|---|
| ስራ | 41% | 34% | 27% | +7% |
| መዝናኛ፣ ማህበራዊ ወይም መዝናኛ | 35% | 42% | 54% | -7% |
| ትምህርት ቤት | 6% | 4% | 5% | +2% |
| ግብይት፣ የግሮሰሪ ዕቃዎች ወይም ስራዎች | 9% | 7% | 4% | +2% |
| የሕክምና | 5% | 4% | 2% | +1% |
| ሃይማኖታዊ እንቅስቃሴዎች | 0% | 1% | 1% | -1% |
| ሌላ | 6% | 9% | 7% | -3% |

የደንበኛ ምርቃት ጥናቶች
ከደንበኛ ልቀት ጋር በተያያዘ የRTDን አፈጻጸም ለመገምገም ሦስት የደንበኛ ፊት ለፊት የተደረጉ ጥናቶች ተካሂደዋል፣ ይህም ኤጀንሲው ከተቀበለባቸው አራት ድርጅቶች አንዱ ነው። ስትራቴጂካዊ ቅድሚያ የሚሰጣቸው ነገሮችእያንዳንዱ የዳሰሳ ጥናት በተናጠል በአውቶቡስ፣ በባቡር እና በፓራትራንስት ደንበኞች ላይ ያተኮረ ሲሆን የአውቶቡስ እና የባቡር ጥናቶች የተካሄዱት በተሽከርካሪ ላይ በሚደረግ የማቋረጥ ዘዴ ነው። የናሙና ዕቅዱ መላውን የአገልግሎት ክልል የሚያካትት ሲሆን ሁሉንም የአውቶቡስ መስመሮች እና የባቡር መስመሮችን እንዲሁም የተመዘገቡ የፓራትራንስት ደንበኞችን ያካትታል።
የተጣራ የማስተዋወቂያ ውጤት
የኤንፒኤስ አጠቃላይ እይታ
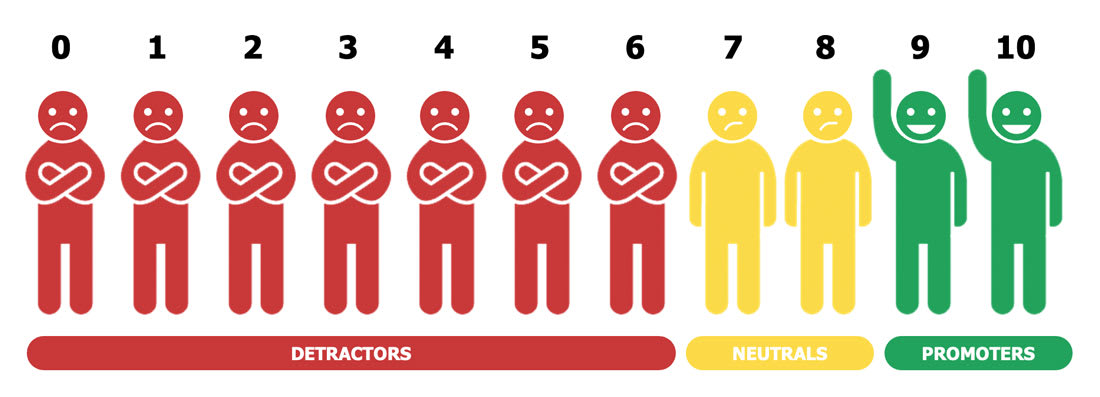
በRTD የደንበኛ እና የማህበረሰብ ጥናቶች የሚቀርበው አስፈላጊ መለኪያ የተጣራ ፕሮሞተር ውጤት (NPS) ነው። NPS ሰዎች የRTDን አገልግሎቶች ለሌላ ሰው የመምከር እድላቸውን የሚለካው ከ -100 እስከ +100 ባለው ሚዛን ላይ በመመስረት ነው።
የዳሰሳ ጥናት ምላሾች በሦስት ምድቦች ይመደባሉ፡
- አስተዋዋቂዎች (9–10)
- ተገብሮ (7–8)
- ዲትራክተሮች (0–6)
የ NPS ማስላት
ውጤቱ የሚሰላው የዴትራክተሮችን መቶኛ ከአስተዋዋቂዎች መቶኛ በመቀነስ፣ አጠቃላይ የእርካታ፣ የታማኝነት እና የRTD አገልግሎቶችን ለመምከር ፈቃደኛነት ስሜት ይሰጣል።

- -100 እስከ 0: ማሻሻያ ያስፈልገዋል
- ከ0 እስከ 20፥ ጥሩ
- ከ21 እስከ 50: ተስማሚ
- ከ51 እስከ 80: በጣም ጥሩ
- ከ81 እስከ 100: የዓለም ደረጃ
የተጣራ የማስተዋወቂያ ውጤት
የተጣመረ የአውቶቡስ፣ የባቡር እና የፓራትራንስት ደንበኞች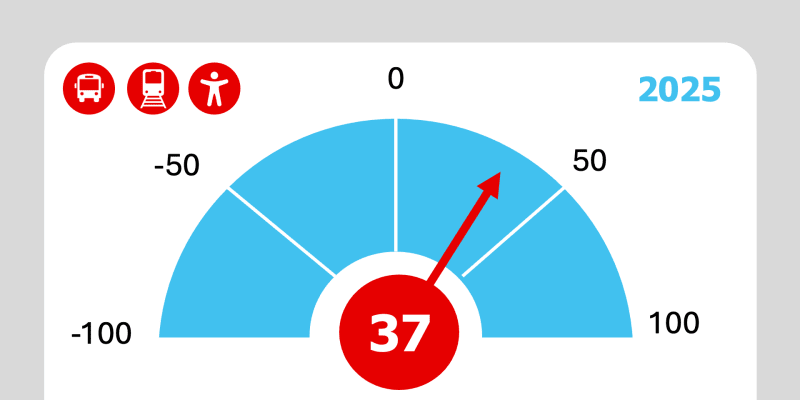 2025የተጣመረ የNPS ውጤት፡ +37
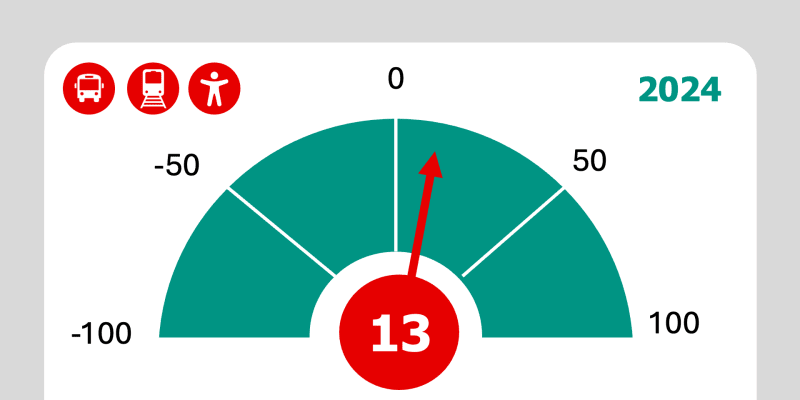 2024የተጣመረ የNPS ውጤት፡ +13
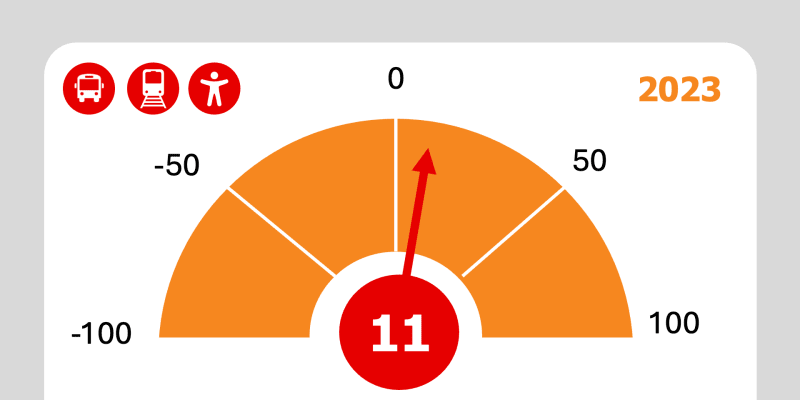 2023የተጣመረ የNPS ውጤት፡ +11
አውቶቡስ፡ የዳሰሳ ጥናት ውጤቶች
የደንበኛ ኔት ፕሮሞተር ውጤቶች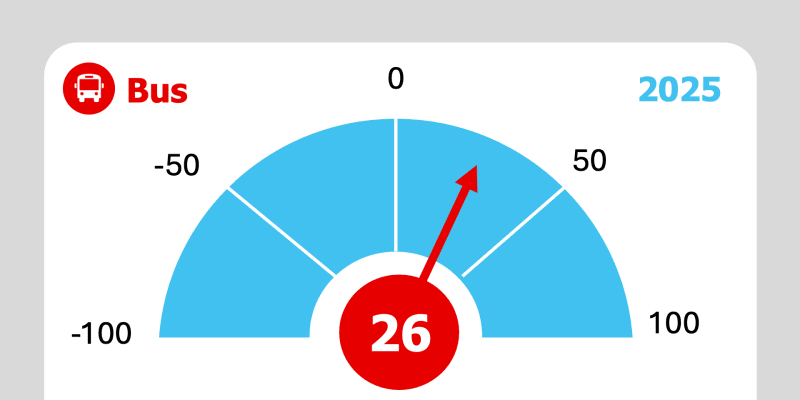 2025የአውቶቡስ NPS ውጤት፡ +26
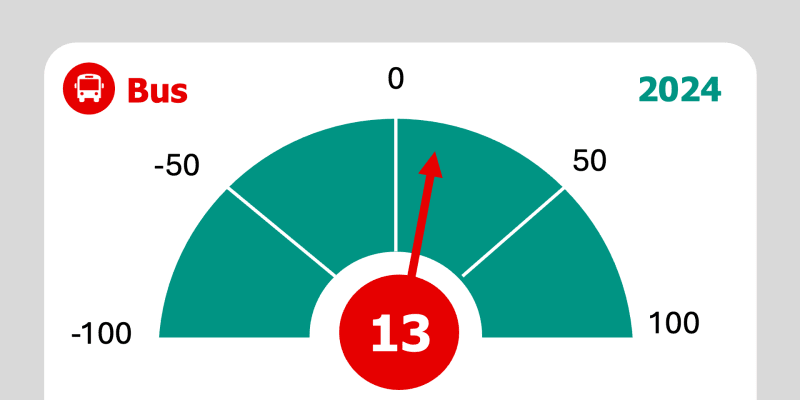 2024የአውቶቡስ NPS ውጤት፡ +13
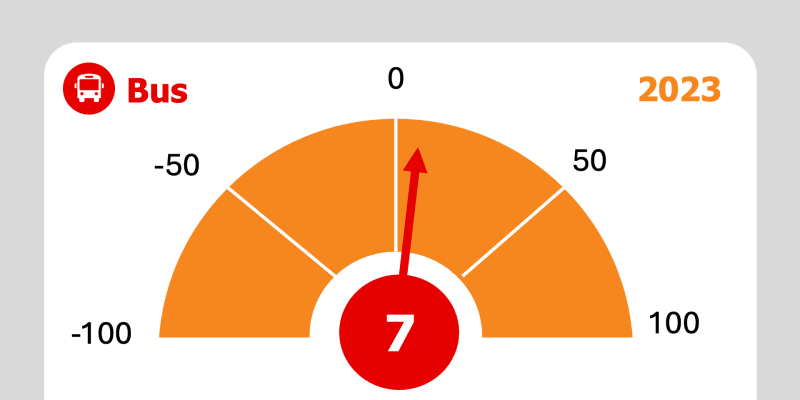 2023የአውቶቡስ NPS ውጤት፡ +7
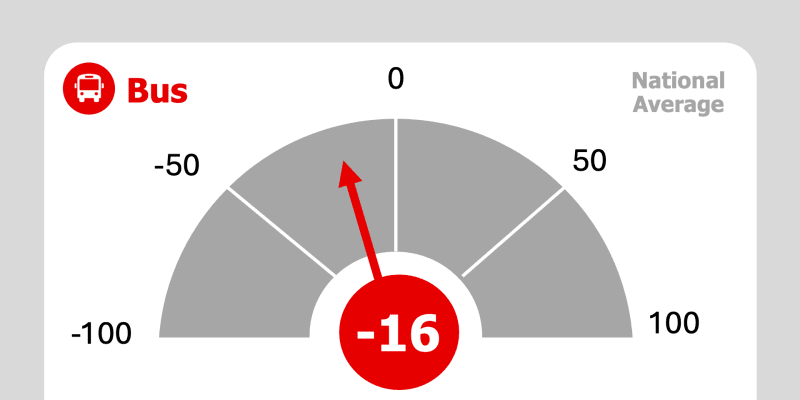 ብሔራዊ አማካይየአውቶቡስ NPS ውጤት፡ -16
አውቶቡስ፡ ዋና ዋና መውሰጃዎች እና ዋና ዋና ነጥቦች
አውቶቡስ፡ ብሔራዊ አማካይአውቶቡሱ በሁሉም 16 የዳሰሳ ጥናት ምድቦች ውስጥ ከአገር አቀፍ አማካይ በልጧል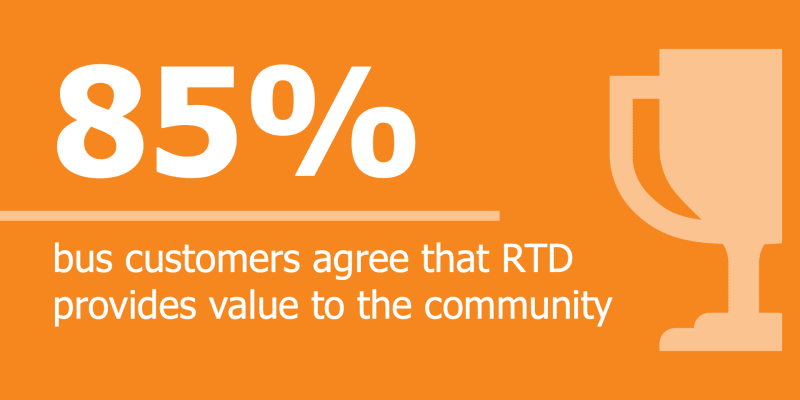 አውቶቡስ፡ የRTD ዋጋ85% የሚሆኑ የአውቶቡስ ደንበኞች RTD ለማህበረሰቡ ዋጋ እንደሚሰጥ ይስማማሉ
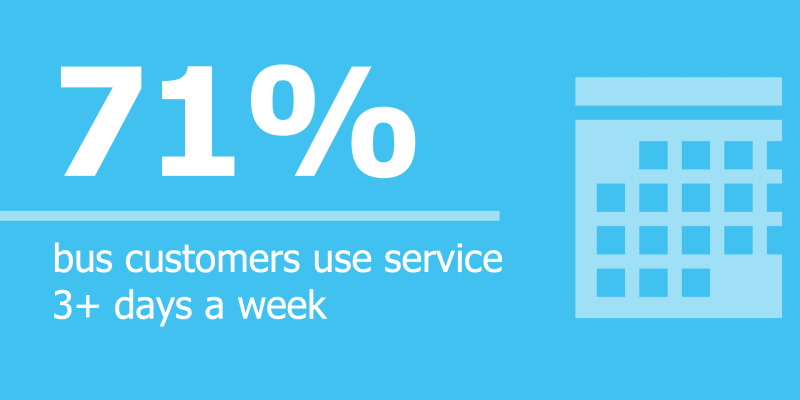 አውቶቡስ፡ የደንበኛ ባህሪ71% የሚሆኑ የአውቶቡስ ደንበኞች በሳምንት ሶስት ወይም ከዚያ በላይ ቀናት የRTD አገልግሎቶችን ይጠቀማሉአውቶቡስ፡ አጠቃላይ እርካታየአውቶቡስ ደንበኞች አጠቃላይ እርካታ ከዓመት ወደ ዓመት 8% ጭማሪ አሳይቷል
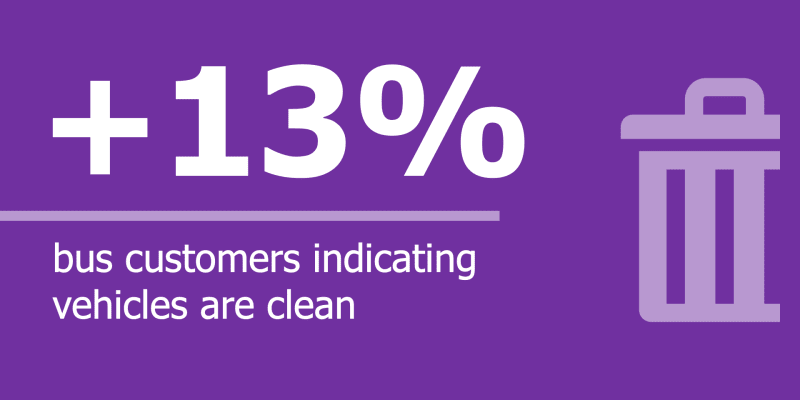 አውቶቡስ፡ የተሽከርካሪዎች ንፅህናየአውቶቡስ ደንበኞች ቁጥር ከዓመት ወደ ዓመት በ13% ጨምሯል፤ ይህም ተሽከርካሪዎች ንፁህ መሆናቸውን ያሳያል
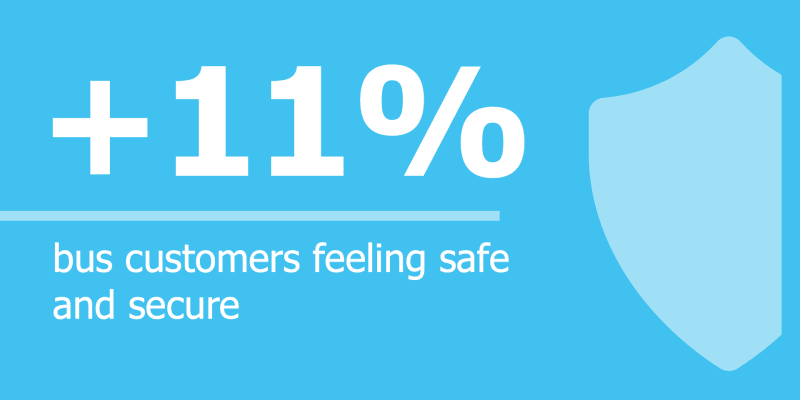 አውቶቡስ፡ ደህንነት እና ደህንነትየአውቶቡስ ደንበኞች በፌርማታ ላይ እያሉ ደህንነት እና ደህንነት የሚሰማቸው የአውቶቡስ ደንበኞች ቁጥር ከዓመት ወደ ዓመት በ11% ጨምሯል
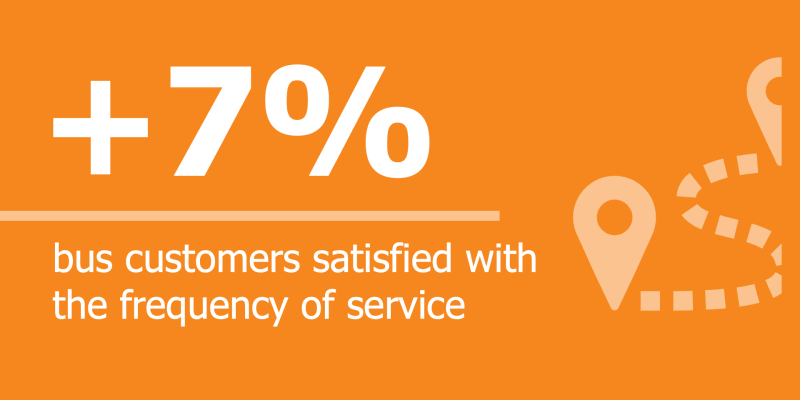 አውቶቡስ፡ የአገልግሎት ድግግሞሽየአውቶቡስ ደንበኞች በአገልግሎቱ ድግግሞሽ ረክተው ወይም በጣም ረክተው ከዓመት ወደ ዓመት 7% ጭማሪ አሳይቷል
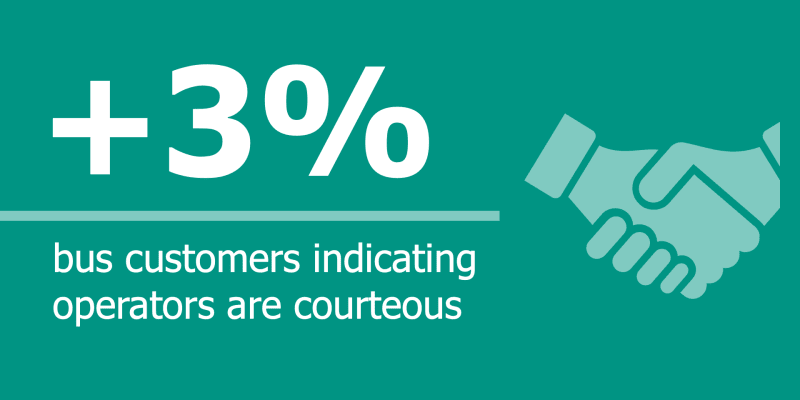 አውቶቡስ፡ ኦፕሬተሮችየአውቶቡስ ኦፕሬተሮች ጨዋዎች መሆናቸውን የሚያሳዩ ደንበኞች ቁጥር ከዓመት ወደ ዓመት በ3% ጨምሯልአውቶቡስ፡ የደንበኛ ባህሪ78% የሚሆኑ የአውቶቡስ ደንበኞች በRTD አገልግሎቶች ላይ ጥገኛ ናቸው
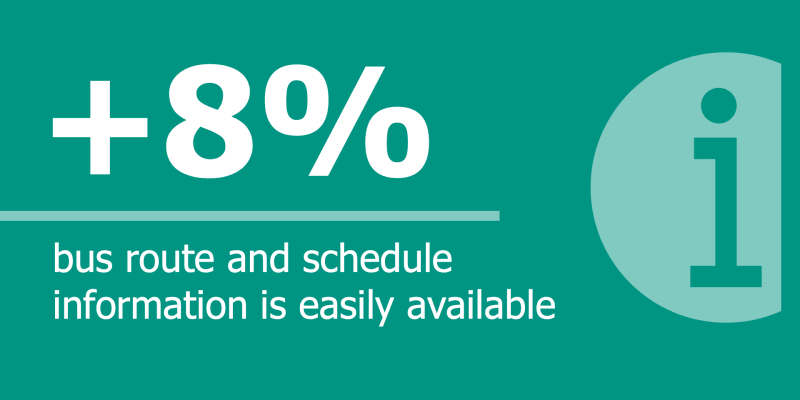 አውቶቡስ፡ መረጃየአውቶቡስ ደንበኞች ቁጥር ከዓመት ወደ ዓመት 8% ጭማሪ አሳይቷል፤ ይህም የመንገድ እና የጊዜ ሰሌዳ መረጃ በቀላሉ ማግኘት እንደሚቻል ያሳያል።
የደንበኛ ባህሪያት
የስነሕዝብ እና የመጓጓዣ አጠቃቀም
አውቶቡስ
- በአብዛኛው ወንድ እና ከ18-39 ዓመት ዕድሜ ያላቸው ሊሆኑ ይችላሉ
- 42% ነጭ ወይም ነጭ
- 21% ሂስፓኒክ፣ ስፓኒሽ ወይም ላቲኖ/a/x
- 20% ጥቁር/አፍሪካዊ አሜሪካዊ
- 63% የሚሆኑት የቤተሰብ ገቢ ከ50,000 ዶላር በታች መሆኑን ሪፖርት አድርገዋል
- 71% በሳምንት ሶስት ወይም ከዚያ በላይ ቀናት የአውቶቡስ አገልግሎት ይጠቀማሉ
- 78% የሚሆኑት በአውቶቡስ አገልግሎት ላይ ጥገኛ ናቸው
- 52% የሚሆኑት ወደ ሥራ ለመሄድና ለመመለስ አውቶቡሶችን ይጠቀማሉ
እርካታ እና ሞገስ
አፈጻጸም
የዳሰሳ ጥናት ምላሽ ሰጪዎች ስምምነት እንዳላቸው የሚያመለክቱ መቶኛ (እስማማለሁ ወይም እስማማለሁ)
| ጥያቄ/ርዕስ | 2025 | 2024 | 2023 | ብሔራዊ አማካይ | የ2025 እና የ2024 ንፅፅር |
|---|---|---|---|---|---|
| አውቶቡሱ ብዙውን ጊዜ በሰዓቱ ይሰራል | 62.2% | 56.5% | 48.7% | 48% | +5.7% |
| አውቶቡሱ ወደ መድረሻዬ በተመጣጣኝ ጊዜ ይወስደኛል | 75.3% | 70.2% | 65.3% | 58% | +5.1% |
| የአገልግሎት ድግግሞሹ አጥጋቢ ነው | 68.0% | 61.0% | 59.9% | 54% | +7.0% |
የግል ደህንነት እና ምቾት
የዳሰሳ ጥናት ምላሽ ሰጪዎች ስምምነት እንዳላቸው የሚያመለክቱ መቶኛ (እስማማለሁ ወይም እስማማለሁ)
| ጥያቄ/ርዕስ | 2025 | 2024 | 2023 | ብሔራዊ አማካይ | የ2025 እና የ2024 ንፅፅር |
|---|---|---|---|---|---|
| አውቶቡሱን እየጠበቅኩ ሳለሁ ደህንነት እና ደህንነት ይሰማኛል | 65.8% | 54.5% | 56.6% | 35% | +11.3% |
| በአውቶቡስ ውስጥ ሳለሁ ደህንነት እና ደህንነት ይሰማኛል | 72.6% | 61.6% | 64.9% | 43% | +11.0% |
| አውቶቡሱ ንጹህ ነው | 67.2% | 53.9% | 61.7% | 38% | +13.3% |
መዳረሻ
የዳሰሳ ጥናት ምላሽ ሰጪዎች ስምምነት እንዳላቸው የሚያመለክቱ መቶኛ (እስማማለሁ ወይም እስማማለሁ)
| ጥያቄ/ርዕስ | 2025 | 2024 | 2023 | ብሔራዊ አማካይ | የ2025 እና የ2024 ንፅፅር |
|---|---|---|---|---|---|
| የታሪፍ ዋጋ ምክንያታዊ ነው | 76.4% | 71.4% | 63.9% | 60% | 5.0% |
| የአውቶቡስ ማቆሚያዎች ምቹ በሆነ ቦታ ላይ ይገኛሉ | 75.9% | 74.1% | 66.2% | 54% | +1.8% |
ኦፕሬሽኖች
የዳሰሳ ጥናት ምላሽ ሰጪዎች ስምምነት እንዳላቸው የሚያመለክቱ መቶኛ (እስማማለሁ ወይም እስማማለሁ)
| ጥያቄ/ርዕስ | 2025 | 2024 | 2023 | ብሔራዊ አማካይ | የ2025 እና የ2024 ንፅፅር |
|---|---|---|---|---|---|
| አውቶቡሶች ለሜካኒካል ደህንነት ተስማሚ እንደሆኑ ይሰማኛል | 88.0% | 84.0% | 79.0% | የለም | +4.0 |
| አውቶቡሶቹ በሚያስፈልጉኝ ቀናት ይሰራሉ | 81.4% | 82.9% | 71.5% | የለም | -1.5% |
| አውቶቡሶቹ በሚያስፈልጉኝ ጊዜ ይሰራሉ | 74.1% | 72.0% | 66.4% | የለም | +2.1% |
መረጃ
የዳሰሳ ጥናት ምላሽ ሰጪዎች ስምምነት እንዳላቸው የሚያመለክቱ መቶኛ (እስማማለሁ ወይም እስማማለሁ)
| ጥያቄ/ርዕስ | 2025 | 2024 | 2023 | ብሔራዊ አማካይ | የ2025 እና የ2024 ንፅፅር |
|---|---|---|---|---|---|
| አውቶቡሶች በጊዜ ሰሌዳው እየሰሩ መሆናቸውን ለማወቅ ቀላል ነው | 68.1% | 57.4% | 69.2% | 54% | +10.7% |
| የRTD አገልግሎት መስተጓጎል ካጋጠመኝ፣ በቂ መረጃ አለኝ | 57.4% | 47.7% | 63.8% | 52% | +9.7% |
| RTD ስለሚያቀርባቸው አገልግሎቶች በቂ መረጃ እንዳቀረበ ይሰማኛል | 82.9% | 72.5% | 80.3% | የለም | 10.4% |
| የጊዜ ሰሌዳ አገልግሎት ለውጦችን በተመለከተ መረጃ እንዳለኝ ይሰማኛል | 63.0% | 54.6% | 65.8% | የለም | +8.4% |
| ስለ መንገድ መርሃ ግብሮች እና ካርታዎች መረጃ በቀላሉ ማግኘት ይቻላል | 81.1% | 73.1% | 75.2% | የለም | +8.0% |
| ስለ መንገድ መርሃ ግብሮች እና ካርታዎች ያለው መረጃ ትክክለኛ ነው | 76.7% | 69.8% | 72.4% | የለም | +6.9% |
| በአጠቃላይ፣ የRTD የመገናኛ ቁሳቁሶች እና ስለ አገልግሎቶች እና የጊዜ ሰሌዳዎች መረጃ ከፍተኛ ጥራት ያላቸው ናቸው | 75.2% | 64.2% | 75.3% | የለም | +11.0% |
የኦፕሬተር ባህሪ
የዳሰሳ ጥናት ምላሽ ሰጪዎች ስምምነት እንዳላቸው የሚያመለክቱ መቶኛ (እስማማለሁ ወይም እስማማለሁ)
| ጥያቄ/ርዕስ | 2025 | 2024 | 2023 | ብሔራዊ አማካይ | የ2025 እና የ2024 ንፅፅር |
|---|---|---|---|---|---|
| የአውቶቡስ አሽከርካሪዎች ተሽከርካሪውን ደህንነቱ በተጠበቀ ሁኔታ ያንቀሳቅሳሉ | 82.8% | 82.5% | 70.8% | 69% | +0.3% |
| የአውቶቡስ አሽከርካሪዎች ጨዋዎች ናቸው | 77.4% | 74.3% | 70.3% | 61% | +3.1% |
| የአውቶቡስ አሽከርካሪዎች ጠቃሚ ናቸው | 77.8% | 75.4% | 68.7% | 60% | +2.4% |
የደንበኛ አገልግሎት
የዳሰሳ ጥናት ምላሽ ሰጪዎች ስምምነት እንዳላቸው የሚያመለክቱ መቶኛ (እስማማለሁ ወይም እስማማለሁ)
| ጥያቄ/ርዕስ | 2025 | 2024 | 2023 | ብሔራዊ አማካይ | የ2025 እና የ2024 ንፅፅር |
|---|---|---|---|---|---|
| ጥያቄዬ፣ ስጋቴ ወይም ቅሬታዬ ተፈቷል | 63.9% | 56.0% | 60.9% | የለም | +7.9% |
| ውሳኔው በወቅቱ ተሰጥቷል | 90.0% | 91.7% | 89.4% | የለም | -1.7% |
| የRTD የደንበኞች አገልግሎት ተወካዮች ጨዋዎች ናቸው | 74.1% | 71.7% | 62.5% | የለም | +2.4% |
መዳረሻዎች እና የገንዘብ ድጋፍ
የዳሰሳ ጥናት ምላሽ ሰጪዎች ስምምነት እንዳላቸው የሚያመለክቱ መቶኛ (እስማማለሁ ወይም እስማማለሁ)
| ጥያቄ/ርዕስ | 2025 | 2024 | 2023 | ብሔራዊ አማካይ | የ2025 እና የ2024 ንፅፅር |
|---|---|---|---|---|---|
| RTD ቁልፍ የህዝብ አገልግሎት መዳረሻዎችን ያቀርባል | 83.6% | 80.2% | 74.5% | የለም | +3.4% |
| የግል ተቋማት፣ ለትርፍ ያልተቋቋሙ ድርጅቶች እና የአካባቢ መንግስታት የአገልግሎት ጥራትን ለማሻሻል እና/ወይም ለማስፋፋት የገንዘብ ድጋፍን ማሳደግን ማጤን አለባቸው | 82.9% | 83.2% | 76.7% | የለም | -0.3% |
የማህበረሰብ እሴት
የዳሰሳ ጥናት ምላሽ ሰጪዎች ስምምነት እንዳላቸው የሚያመለክቱ መቶኛ (እስማማለሁ ወይም እስማማለሁ)
| ጥያቄ/ርዕስ | 2025 | 2024 | 2023 | ብሔራዊ አማካይ | የ2025 እና የ2024 ንፅፅር |
|---|---|---|---|---|---|
| RTD ለማህበረሰቡ ዋጋ ይሰጣል | 84.6% | 84.2% | 72.7% | 67% | +0.4% |
የባቡር ሐዲድ፡ የዳሰሳ ጥናት ውጤቶች
የደንበኛ ኔት ፕሮሞተር ውጤቶች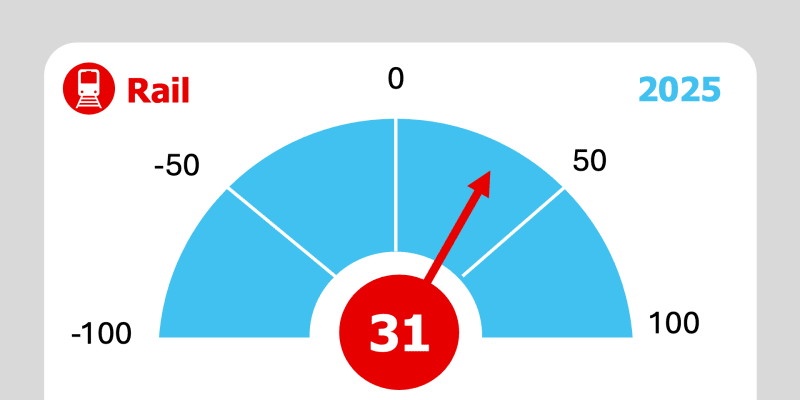 2025የባቡር NPS ነጥብ፡ +31
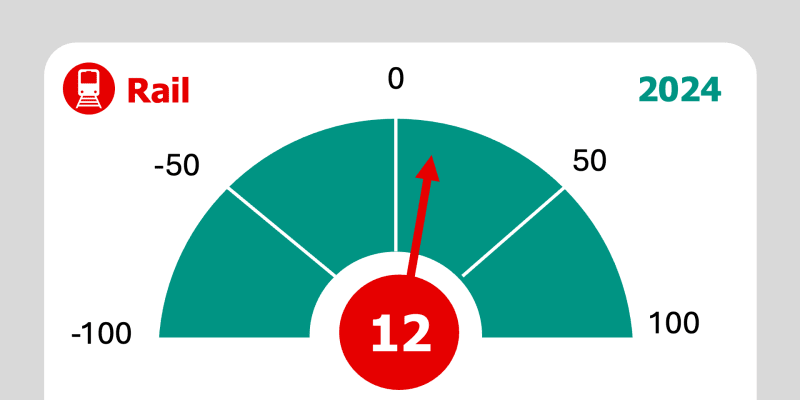 2024የባቡር NPS ነጥብ፡ +12
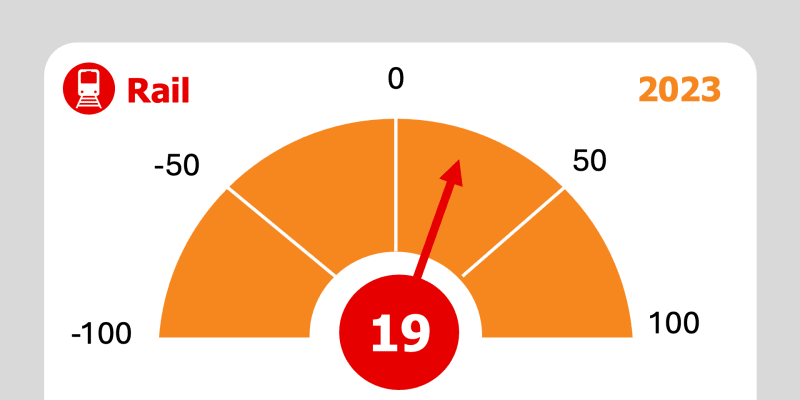 2023የባቡር NPS ነጥብ፡ +19
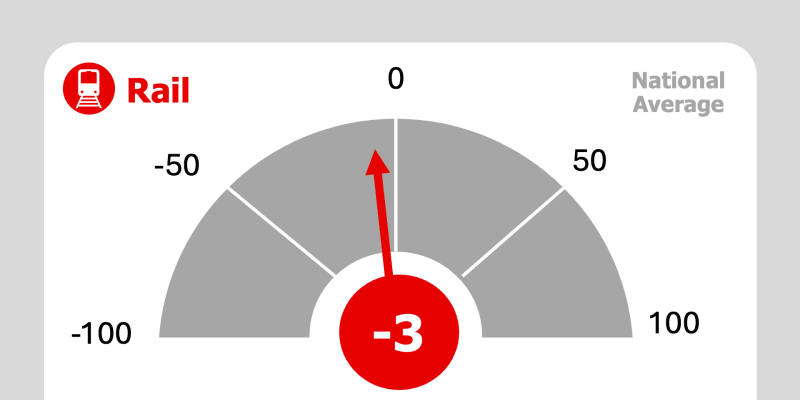 ብሔራዊ አማካይየባቡር NPS ውጤት፡ -3
የባቡር ሐዲድ፡ ዋና ዋና ነጥቦች እና ዋና ዋና ነጥቦች
የባቡር ሐዲድ፡ ብሔራዊ አማካይየባቡር መስመር ከ16ቱ የዳሰሳ ጥናት ምድቦች ውስጥ በ15ቱ ውስጥ ከአገር አቀፍ አማካይ በልጧልየባቡር ሐዲድ፡ የደንበኛ ባህሪ65% የሚሆኑ የባቡር ደንበኞች በRTD አገልግሎቶች ላይ ጥገኛ ናቸውየባቡር ሐዲድ፡ አጠቃላይ እርካታየባቡር ደንበኞች አጠቃላይ እርካታ ከዓመት ወደ ዓመት 12% ጭማሪ አሳይቷል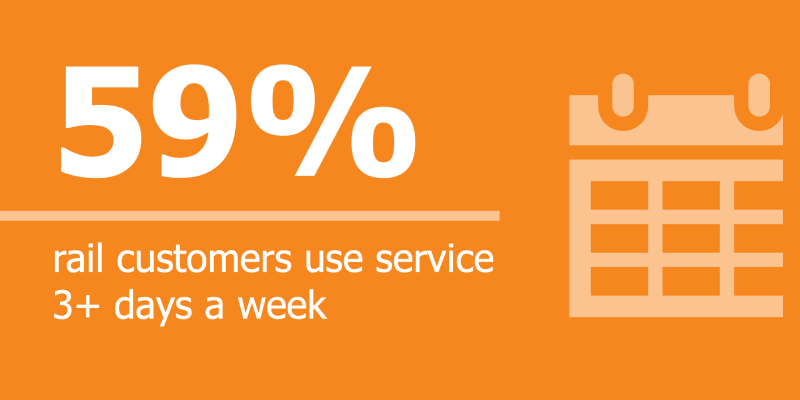 የባቡር ሐዲድ፡ የደንበኛ ባህሪ59% የሚሆኑ የባቡር ደንበኞች በሳምንት ሶስት ወይም ከዚያ በላይ ቀናት የRTD አገልግሎቶችን ይጠቀማሉ
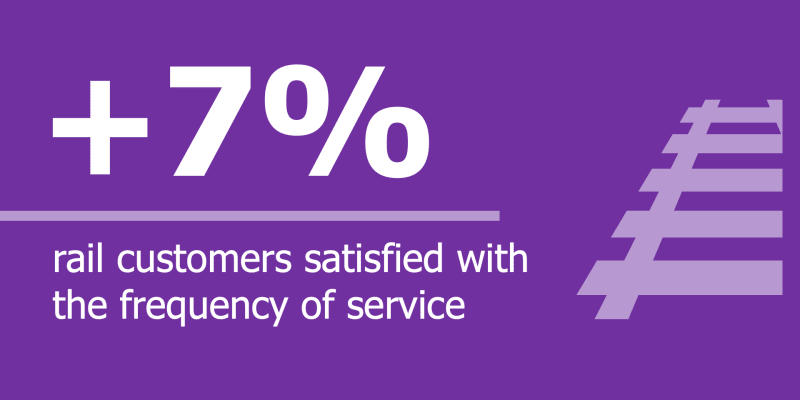 የባቡር ሐዲድ፡ የአገልግሎት ድግግሞሽየባቡር ደንበኞች በአገልግሎት ድግግሞሽ ረክተው ወይም በጣም ረክተው ከዓመት ወደ ዓመት 7% ጭማሪ አሳይተዋል
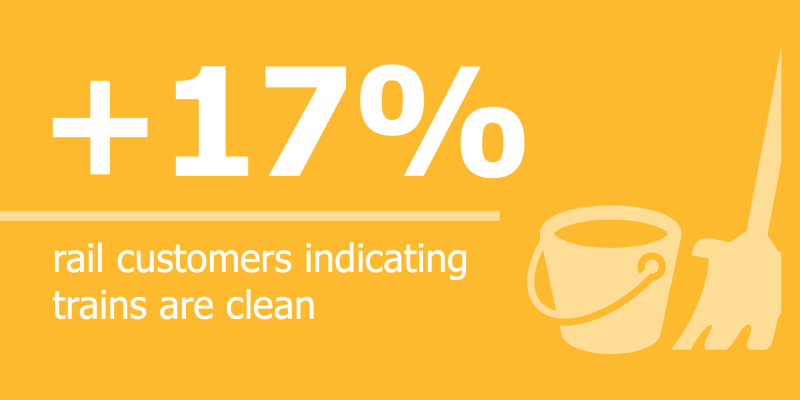 የባቡር ሐዲድ፡ የተሽከርካሪዎች ንፅህናየባቡር ደንበኞች ቁጥር ከዓመት ወደ ዓመት በ17% ጭማሪ አሳይቷል፤ ይህም ባቡሮቹ ንጹህ መሆናቸውን ያሳያል
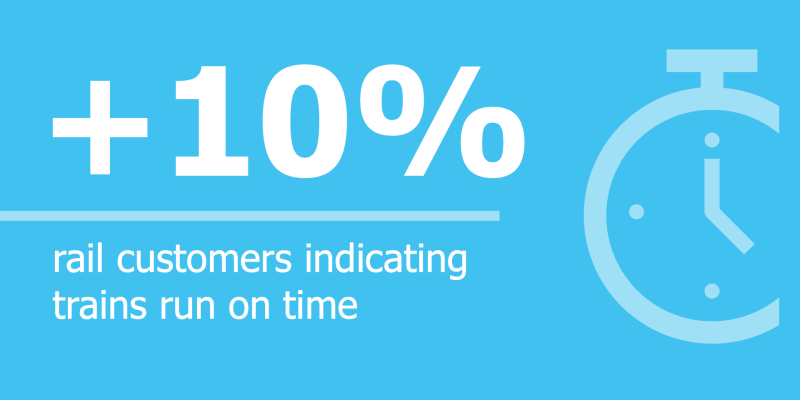 የባቡር ሐዲድ፡ በሰዓቱ የሚከናወን አፈጻጸምየባቡር ደንበኞች ቁጥር ከዓመት ወደ ዓመት በ10% ጨምሯል፤ ይህም ባቡሮቹ በሰዓቱ እንዲሰሩ ያደርጋል
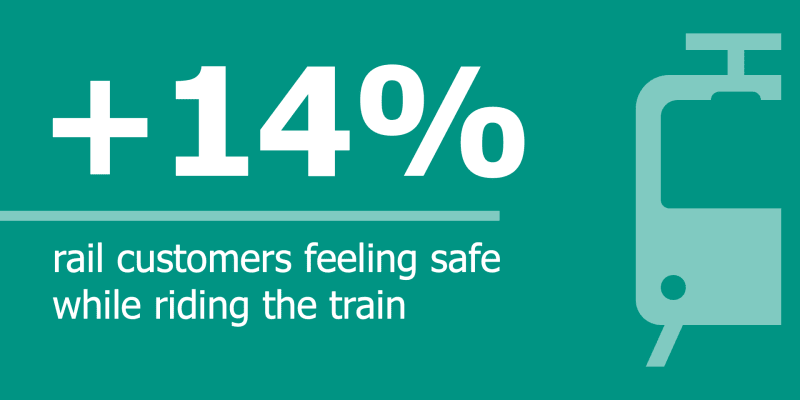 የባቡር ሐዲድ፡ ደህንነት እና ደህንነትየባቡር ደንበኞች በባቡር ሲጓዙ ደህንነት የሚሰማቸው በዓመቱ በ14% ጭማሪ አሳይቷል
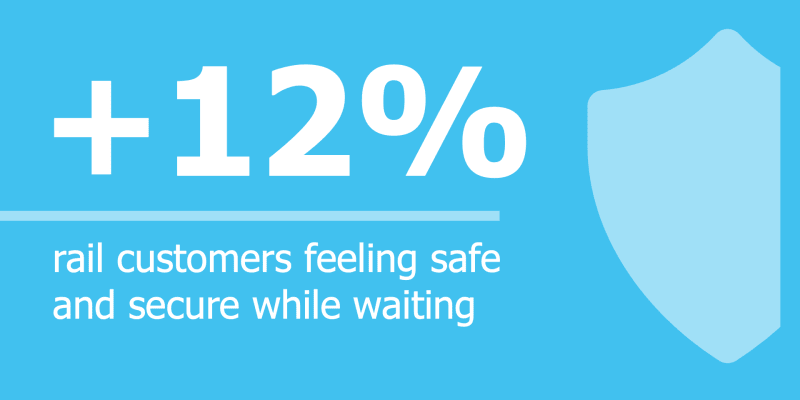 የባቡር ሐዲድ፡ ደህንነት እና ደህንነትየባቡር ደንበኞች ጣቢያ ሲጠብቁ ደህንነት እና ደህንነት የሚሰማቸው ከዓመት ወደ ዓመት 12% ጭማሪ አሳይቷል
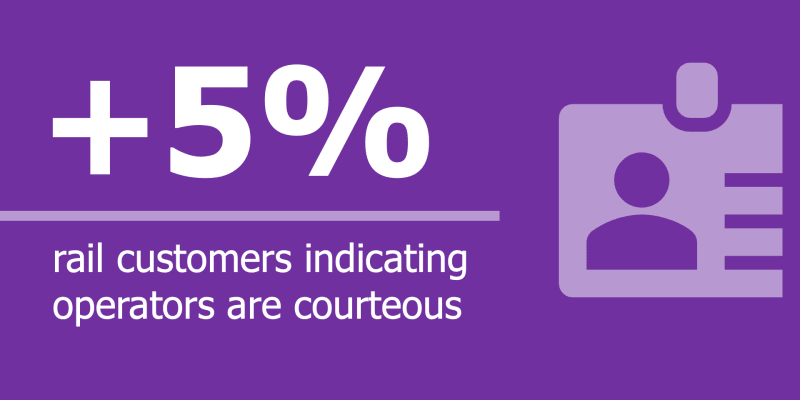 የባቡር ሐዲድ፡ ኦፕሬተሮችየባቡር አገልግሎት ሰጪዎች ጨዋዎች መሆናቸውን የሚያሳዩ ደንበኞች ቁጥር ከዓመት ወደ ዓመት በ5% ጨምሯል
የደንበኛ ባህሪያት
የስነሕዝብ እና የመጓጓዣ አጠቃቀም
የባቡር ሐዲድ
- በአብዛኛው ወንድ እና ከ18-39 ዓመት ዕድሜ ያላቸው ሊሆኑ ይችላሉ
- 50% ነጭ ወይም ነጭ
- 17% ሂስፓኒክ፣ ስፓኒሽ ወይም ላቲኖ/a/x
- 12% ጥቁር/አፍሪካዊ አሜሪካዊ
- 40% የሚሆኑት የቤተሰብ ገቢ ከ50,000 ዶላር በታች መሆኑን ሪፖርት አድርገዋል
- 59% በሳምንት ሶስት ወይም ከዚያ በላይ ቀናት የባቡር ሐዲድ ይጠቀማሉ
- 65% የሚሆኑት በባቡር አገልግሎት ላይ ጥገኛ ናቸው
- 48% የሚሆኑት ወደ ሥራ ለመሄድና ለመመለስ ባቡሮችን ይጠቀማሉ
እርካታ እና ሞገስ
አፈጻጸም
የዳሰሳ ጥናት ምላሽ ሰጪዎች ስምምነት እንዳላቸው የሚያመለክቱ መቶኛ (እስማማለሁ ወይም እስማማለሁ)
| ጥያቄ/ርዕስ | 2025 | 2024 | 2023 | ብሔራዊ አማካይ | የ2025 እና የ2024 ንፅፅር |
|---|---|---|---|---|---|
| ባቡሩ አብዛኛውን ጊዜ በሰዓቱ ይሰራል | 62.7% | 53.1% | 53.2% | 53% | +9.6% |
| ባቡሩ ወደ መድረሻዬ በተመጣጣኝ ጊዜ ይወስደኛል | 78.4% | 71.5% | 62.2% | 71% | +6.9% |
| የአገልግሎት ድግግሞሹ አጥጋቢ ነው | 69.7% | 62.6% | 61.5% | 57% | +7.1% |
የግል ደህንነት እና ምቾት
የዳሰሳ ጥናት ምላሽ ሰጪዎች ስምምነት እንዳላቸው የሚያመለክቱ መቶኛ (እስማማለሁ ወይም እስማማለሁ)
| ጥያቄ/ርዕስ | 2025 | 2024 | 2023 | ብሔራዊ አማካይ | የ2025 እና የ2024 ንፅፅር |
|---|---|---|---|---|---|
| ባቡሩን እየጠበቅኩ ሳለሁ ደህንነት እና ደህንነት ይሰማኛል | 67.2% | 55.6% | 57.7% | 34% | +11.6% |
| በባቡር ስጓዝ ደህንነት እና ደህንነት ይሰማኛል | 75.5% | 61.7% | 62.6% | 46% | +13.8% |
| ባቡሩ ንጹህ ነው | 70.8% | 54.2% | 62.0% | 39% | +16.6% |
መዳረሻ
የዳሰሳ ጥናት ምላሽ ሰጪዎች ስምምነት እንዳላቸው የሚያመለክቱ መቶኛ (እስማማለሁ ወይም እስማማለሁ)
| ጥያቄ/ርዕስ | 2025 | 2024 | 2023 | ብሔራዊ አማካይ | የ2025 እና የ2024 ንፅፅር |
|---|---|---|---|---|---|
| የታሪፍ ዋጋ ምክንያታዊ ነው | 77.5% | 76.1% | 63.1% | 60% | +1.4% |
| የባቡር ጣቢያዎች/መስመሮች ምቹ በሆነ ቦታ ላይ ይገኛሉ | 83.3% | 79.0% | 69.6% | 59% | +4.3% |
ኦፕሬሽኖች
የዳሰሳ ጥናት ምላሽ ሰጪዎች ስምምነት እንዳላቸው የሚያመለክቱ መቶኛ (እስማማለሁ ወይም እስማማለሁ)
| ጥያቄ/ርዕስ | 2025 | 2024 | 2023 | ብሔራዊ አማካይ | የ2025 እና የ2024 ንፅፅር |
|---|---|---|---|---|---|
| ባቡሮቹ ለሜካኒካል ደህንነቱ የተጠበቀ እንደሆኑ ይሰማኛል | 89.4% | 88.0% | 80.0% | የለም | +1.4% |
| ባቡሮቹ በሚያስፈልጉኝ ቀናት ይሰራሉ | 86.5% | 86.1% | 76.8% | የለም | +0.4% |
| ባቡሮቹ በሚያስፈልጉኝ ጊዜ ይሰራሉ | 77.5% | 70.8% | 66.5% | የለም | +6.7% |
መረጃ
የዳሰሳ ጥናት ምላሽ ሰጪዎች ስምምነት እንዳላቸው የሚያመለክቱ መቶኛ (እስማማለሁ ወይም እስማማለሁ)
| ጥያቄ/ርዕስ | 2025 | 2024 | 2023 | ብሔራዊ አማካይ | የ2025 እና የ2024 ንፅፅር |
|---|---|---|---|---|---|
| ባቡሮች በጊዜ ሰሌዳው እየሰሩ መሆኑን ለማወቅ ቀላል ነው | 66.0% | 59.9% | 61.9% | 56% | +6.1% |
| የRTD አገልግሎት መስተጓጎል ካጋጠመኝ፣ በቂ መረጃ አለኝ | 55.6% | 50.9% | 56.1% | 60% | +4.7% |
| RTD ስለሚያቀርባቸው አገልግሎቶች በቂ መረጃ እንዳቀረበ ይሰማኛል | 83.8% | 74.4% | 79.9% | የለም | +9.5% |
| የጊዜ ሰሌዳ አገልግሎት ለውጦችን በተመለከተ መረጃ እንዳለኝ ይሰማኛል | 62.5% | 54.8% | 59.7% | የለም | +7.8% |
| ስለ መንገድ መርሃ ግብሮች እና ካርታዎች መረጃ በቀላሉ ማግኘት ይቻላል | 79.6% | 77.9% | 73.8% | የለም | +1.7% |
| ስለ መንገድ መርሃ ግብሮች እና ካርታዎች ያለው መረጃ ትክክለኛ ነው | 78.6% | 72.1% | 71.0% | የለም | +6.5% |
| በአጠቃላይ፣ የRTD የመገናኛ ቁሳቁሶች እና ስለ አገልግሎቶች እና የጊዜ ሰሌዳዎች መረጃ ከፍተኛ ጥራት ያላቸው ናቸው | 73.7% | 67.1% | 70.2% | የለም | +6.6% |
የኦፕሬተር ባህሪ
የዳሰሳ ጥናት ምላሽ ሰጪዎች ስምምነት እንዳላቸው የሚያመለክቱ መቶኛ (እስማማለሁ ወይም እስማማለሁ)
| ጥያቄ/ርዕስ | 2025 | 2024 | 2023 | ብሔራዊ አማካይ | የ2025 እና የ2024 ንፅፅር |
|---|---|---|---|---|---|
| የባቡር አሽከርካሪዎች ተሽከርካሪውን ደህንነቱ በተጠበቀ ሁኔታ ያንቀሳቅሳሉ | 86.2% | 85.1% | 78.1% | 72% | +1.1% |
| የባቡር አሽከርካሪዎች ጨዋዎች ናቸው | 84.9% | 80.4% | 73.2% | 57% | +4.5% |
| የባቡር አሽከርካሪዎች ጠቃሚ ናቸው | 82.1% | 77.3% | 73.2% | 61% | +4.8% |
የደንበኛ አገልግሎት
የዳሰሳ ጥናት ምላሽ ሰጪዎች ስምምነት እንዳላቸው የሚያመለክቱ መቶኛ (እስማማለሁ ወይም እስማማለሁ)
| ጥያቄ/ርዕስ | 2025 | 2024 | 2023 | ብሔራዊ አማካይ | የ2025 እና የ2024 ንፅፅር |
|---|---|---|---|---|---|
| ጥያቄዬ፣ ስጋቴ ወይም ቅሬታዬ ተፈቷል | 61.6% | 56.9% | 58.6% | የለም | +4.8% |
| ውሳኔው በወቅቱ ተሰጥቷል | 84.1% | 93.2% | 92.7% | የለም | -9.1% |
| የRTD የደንበኞች አገልግሎት ተወካዮች ጨዋዎች ናቸው | 68.4% | 69.6% | 66.0% | የለም | -1.2% |
መዳረሻዎች እና የገንዘብ ድጋፍ
የዳሰሳ ጥናት ምላሽ ሰጪዎች ስምምነት እንዳላቸው የሚያመለክቱ መቶኛ (እስማማለሁ ወይም እስማማለሁ)
| ጥያቄ/ርዕስ | 2025 | 2024 | 2023 | ብሔራዊ አማካይ | የ2025 እና የ2024 ንፅፅር |
|---|---|---|---|---|---|
| RTD ቁልፍ የህዝብ አገልግሎት መዳረሻዎችን ያቀርባል | 85.5% | 84.3% | 75.8% | የለም | +1.2% |
| የግል ተቋማት፣ ለትርፍ ያልተቋቋሙ ድርጅቶች እና የአካባቢ መንግስታት የአገልግሎት ጥራትን ለማሻሻል እና/ወይም ለማስፋፋት የገንዘብ ድጋፍን ማሳደግን ማጤን አለባቸው | 84.4% | 88.6% | 75.8% | የለም | -4.3% |
የማህበረሰብ እሴት
የዳሰሳ ጥናት ምላሽ ሰጪዎች ስምምነት እንዳላቸው የሚያመለክቱ መቶኛ (እስማማለሁ ወይም እስማማለሁ)
| ጥያቄ/ርዕስ | 2025 | 2024 | 2023 | ብሔራዊ አማካይ | የ2025 እና የ2024 ንፅፅር |
|---|---|---|---|---|---|
| RTD ለማህበረሰቡ ዋጋ ይሰጣል | 86.6% | 85.0% | 79.0% | 73% | +1.6% |
ፓራትራንስት፡ የዳሰሳ ጥናት ውጤቶች
የደንበኛ ኔት ፕሮሞተር ውጤቶች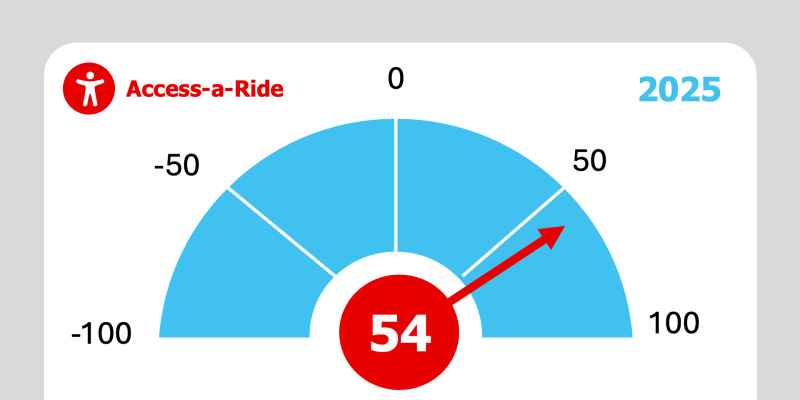 2025የመዳረሻ-ኤ-ራይድ NPS ውጤት፡ +54
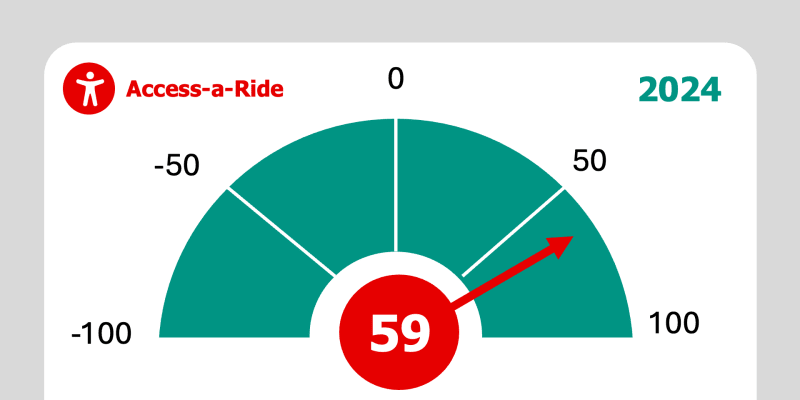 2024የመዳረሻ-ኤ-ራይድ NPS ውጤት፡ +59
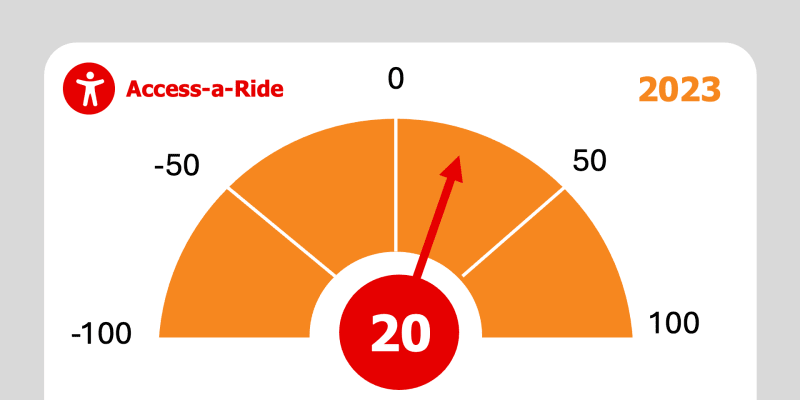 2023የመዳረሻ-ኤ-ራይድ NPS ውጤት፡ +20
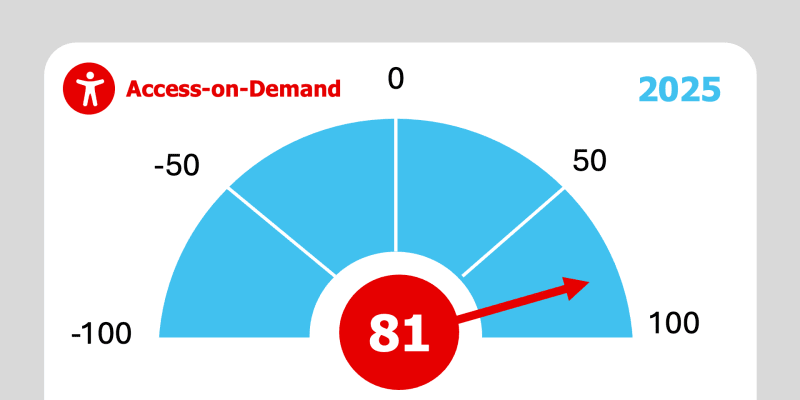 2025በፍላጎት ላይ የመዳረሻ-በፍላጎት ላይ የNPS ነጥብ፡ +81
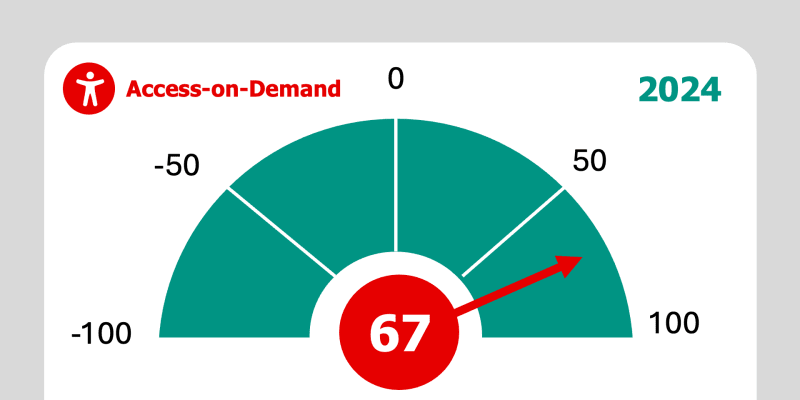 2024በፍላጎት ላይ የመዳረሻ-በፍላጎት ላይ የNPS ውጤት፡ +67
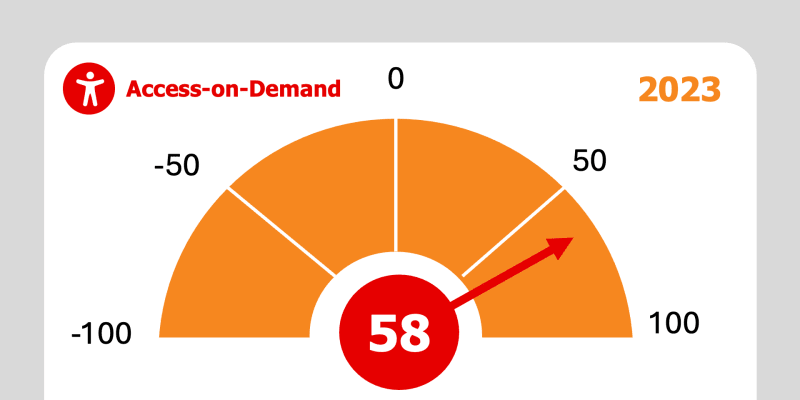 2023በፍላጎት ላይ የመዳረሻ-በፍላጎት ላይ የNPS ውጤት፡ +58
የደንበኛ ባህሪያት
የስነሕዝብ እና የመጓጓዣ አጠቃቀም
ፓራትራንስት
- በአብዛኛው ሴቶች እና ከ65 ዓመት በላይ የሆኑ ሰዎች ሊሆኑ ይችላሉ
- AaR:64% AoD:66% ነጭ ወይም ነጭ
- AaR:16% AoD:12% ሂስፓኒክ፣ ስፓኒሽ ወይም ላቲኖ/a/x
- AaR:18% AoD:15% ጥቁር/አፍሪካዊ አሜሪካዊ
- AaR:86% AOD:90% የቤተሰብ ገቢ ከ50,000 ዶላር በታች መሆኑን ሪፖርት አድርገዋል
- AaR፡- 52% የሚሆኑት የዳሰሳ ጥናት የተደረገባቸው ተጠቃሚዎች ለአብዛኛዎቹ ጉዞዎቻቸው AaR ይጠቀማሉ
- AaR፡ 41% የሚሆኑት ለህክምና ቀጠሮዎች አገልግሎቶችን ይጠቀማሉ
- AoD፡- 74% የሚሆኑት የዳሰሳ ጥናት የተደረገባቸው ተጠቃሚዎች አብዛኛውን ጉዞአቸውን ለማድረግ AoDን ይጠቀማሉ
- AOD፡ 45% የሚሆኑት ለህክምና ቀጠሮዎች አገልግሎቶችን ይጠቀማሉ
አመት፥ አክሰስ-ኤ-ራይድ
ኤኦዲ፡ በፍላጎት ላይ መድረስ
እርካታ እና ሞገስ
አጠቃላይ እርካታ
የዳሰሳ ጥናት ምላሽ ሰጪዎች እርካታን የሚያመለክቱ መቶኛ (እርካታ ወይም በጣም እርካታ)
| ጥያቄ/ርዕስ | 2025 | 2024 | 2023 | ብሔራዊ አማካይ | የ2025 እና የ2024 ንፅፅር |
|---|---|---|---|---|---|
| አክሰስ-ኤ-ራይድ | 84% | 80% | የለም | +4% | |
| በፍላጎት ላይ መድረስ | 97% | 86% | +11% |

የማህበረሰብ እሴት ጥናት
ከደንበኞች በቀጥታ ግብረመልስ ከመሰብሰብ በተጨማሪ፣ RTD በዴንቨር ሜትሮ አካባቢ ካሉ ቤተሰቦች የተለየ አስተያየት ጠይቋል።
ማህበረሰብ፡ የዳሰሳ ጥናት ውጤቶች
የማህበረሰብ ኔት ፕሮሞተር ውጤቶች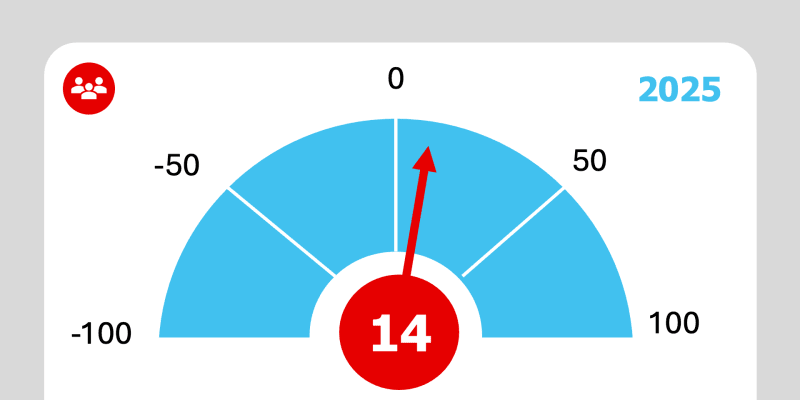 2025የማህበረሰብ የNPS ውጤት፡ +14
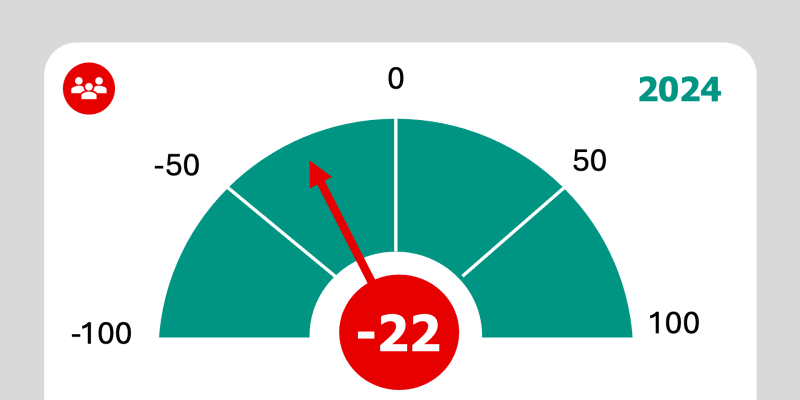 2024የማህበረሰብ NPS ውጤት፡ -22
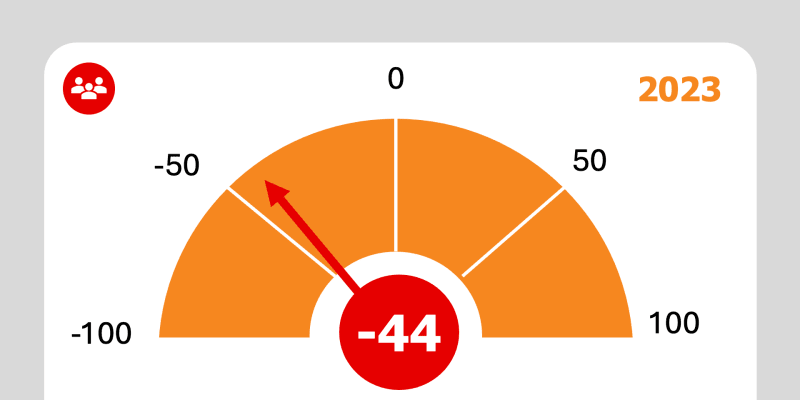 2023የማህበረሰብ የNPS ውጤት፡ -44
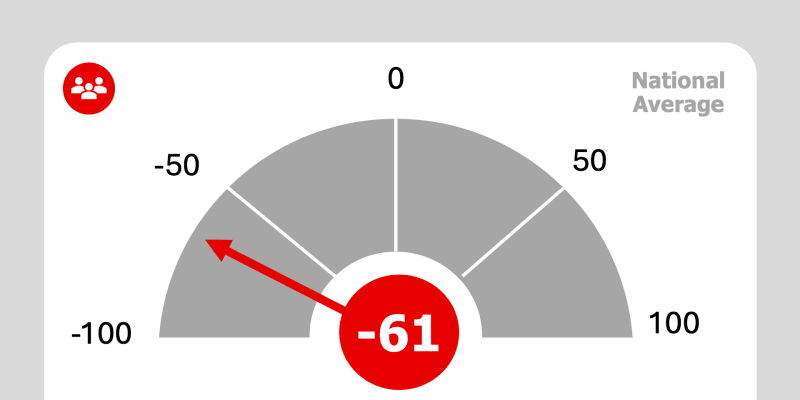 ብሔራዊ አማካይየማህበረሰብ NPS ውጤት፡ -61
የRTD እሴት
የእሴት ግንዛቤ
ዋጋ ያላቸው ወይም እጅግ በጣም ዋጋ ያላቸው መሆናቸውን የሚያመለክቱ የዳሰሳ ጥናት ምላሽ ሰጪዎች መቶኛ
| ጥያቄ/ርዕስ | 2025 | 2024 | 2023 | ብሔራዊ አማካይ | የ2025 እና የ2024 ንፅፅር |
|---|---|---|---|---|---|
| ለታላቁ የዴንቨር ክልል ዋጋ | 86% | 86% | 84% | 66% | +0% |
| ለእርስዎ በግል ዋጋ | 73% | 62% | 54% | 31% | +11% |
| ልዩ የመንቀሳቀስ ፍላጎት ላላቸው ሰዎች የትራንስፖርት አማራጮችን መስጠት | 88% | 88% | 82% | 78% | +0% |
| ተመጣጣኝ የትራንስፖርት አማራጮችን ማቅረብ | 82% | 80% | 78% | 77% | +2% |
| የህይወት ጥራትን ማሻሻል | 76% | 75% | 66% | 56% | +1% |
| በክልሉ ውስጥ ተጨማሪ የሥራ ዕድሎችን መሳብ እና ማቆየት | 64% | 65% | 62% | 54% | -1% |
| የትራፊክ መጨናነቅን መቀነስ | 80% | 78% | 75% | 56% | +2% |
| መንገዶችን ለሁሉም ተጠቃሚዎች ደህንነቱ የተጠበቀ ማድረግ | 74% | 73% | 68% | 45% | +1% |
| የሥራ ቦታዎችን ማግኘት የሚያስችል አገልግሎት መስጠት | 77% | 73% | 68% | 69% | +4% |
| የሕክምና ተቋማትን ተደራሽ ማድረግ | 69% | 69% | 62% | 77% | +0% |
| የትምህርት ተቋማትን ተደራሽ ማድረግ | 78% | 81% | 75% | 72% | -3% |
| የመዝናኛ ቦታዎችን ማግኘት ያስችላል | 76% | 77% | 73% | 57% | -1% |
| ዘላቂ የሆኑ ልምዶችን ማሳካት፣ ብክለትን እና የካርቦን አሻራን መቀነስ | 83% | 83% | 82% | 58% | +0% |
| አስተማማኝ የትራንስፖርት አማራጭ መስጠት | 81% | 77% | 73% | 74% | +4% |
| ወደ ክልሉ፣ አጎራባች ከተሞችና አውራጃዎች መዳረሻ መስጠት | 69% | 71% | 61% | 69% | -2% |
| የማህበረሰብ ንግድን መደገፍ | 68% | 72% | 64% | የለም | -4% |
| ተመጣጣኝ ዋጋ ያላቸውን ቤቶች ለማግኘት እድሎችን መስጠት | 63% | 63% | 53% | የለም | +0% |
ከአገልግሎት ጋር የተያያዘ ጥቅም
የፍላጎት ግንዛቤ
የዳሰሳ ጥናት ምላሽ ሰጪዎች ስምምነት እንዳላቸው የሚያመለክቱ መቶኛ (እስማማለሁ ወይም እስማማለሁ)
| ጥያቄ/ርዕስ | 2025 | 2024 | 2023 | ብሔራዊ አማካይ | የ2025 እና የ2024 ንፅፅር |
|---|---|---|---|---|---|
| ስለ RTD ብራንድ አዎንታዊ ግንዛቤ አለኝ | 48% | 46% | 44% | 45% | +2% |
| የRTD አገልግሎቶችን ስጠቀም የግል ደህንነት ይሰማኛል | 46% | 43% | 40% | 55% | +3% |
| RTD የቅጥር ማዕከሎችን በበቂ ሁኔታ ያገለግላል | 44% | 36% | 36% | 32% | +8% |
| የRTD የፋይናንስ ሪፖርት ለመረዳት የሚቻል እና ግልጽ ነው | 27% | 25% | 20% | 22% | +2% |
| የRTD ተሽከርካሪዎች ለሜካኒካል ደህንነቱ የተጠበቀ እንደሆኑ ይሰማኛል | 90% | 85% | 88% | 55% | +5% |
| የRTD አገልግሎቶች ለተለያዩ የአካል ጉዳተኞች ተደራሽ ናቸው | 76% | 72% | 74% | 42% | +4% |
| RTD የተለያዩ፣ ፍትሃዊ እና ሁሉን አቀፍ የማህበረሰብ ሀብት ነው | 71% | 63% | 61% | የለም | +8% |
| የRTD አገልግሎት የማህበረሰብ ንግድን ይደግፋል | 52% | 48% | 45% | የለም | +4% |
| ማህበረሰቡ በትራንስፖርት ላይ የሚያደርገው ኢንቨስትመንት ዋጋ ይሰጣል | 82% | 81% | 80% | የለም | +1% |
| RTD አስተማማኝ ነው | 44% | 40% | 37% | 55% | +4% |
| RTD ጥሩ የህዝብ ገንዘብ አስተዳዳሪ ነው | 33% | 29% | 27% | የለም | +4% |
| RTD የፋይናንስ ሀብቶቹን በሚገባ ያስተዳድራል | 21% | 19% | 14% | የለም | +2% |