Customer and Community Surveys
Results, Key Takeaways, and Highlights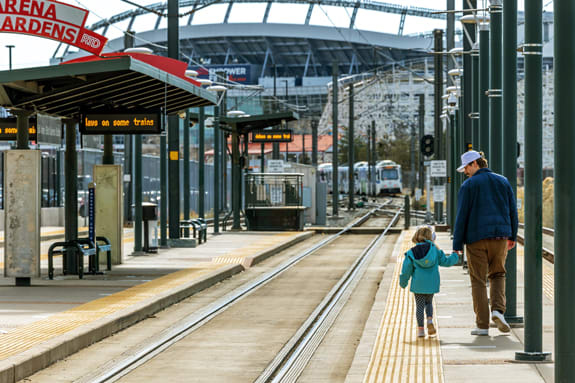
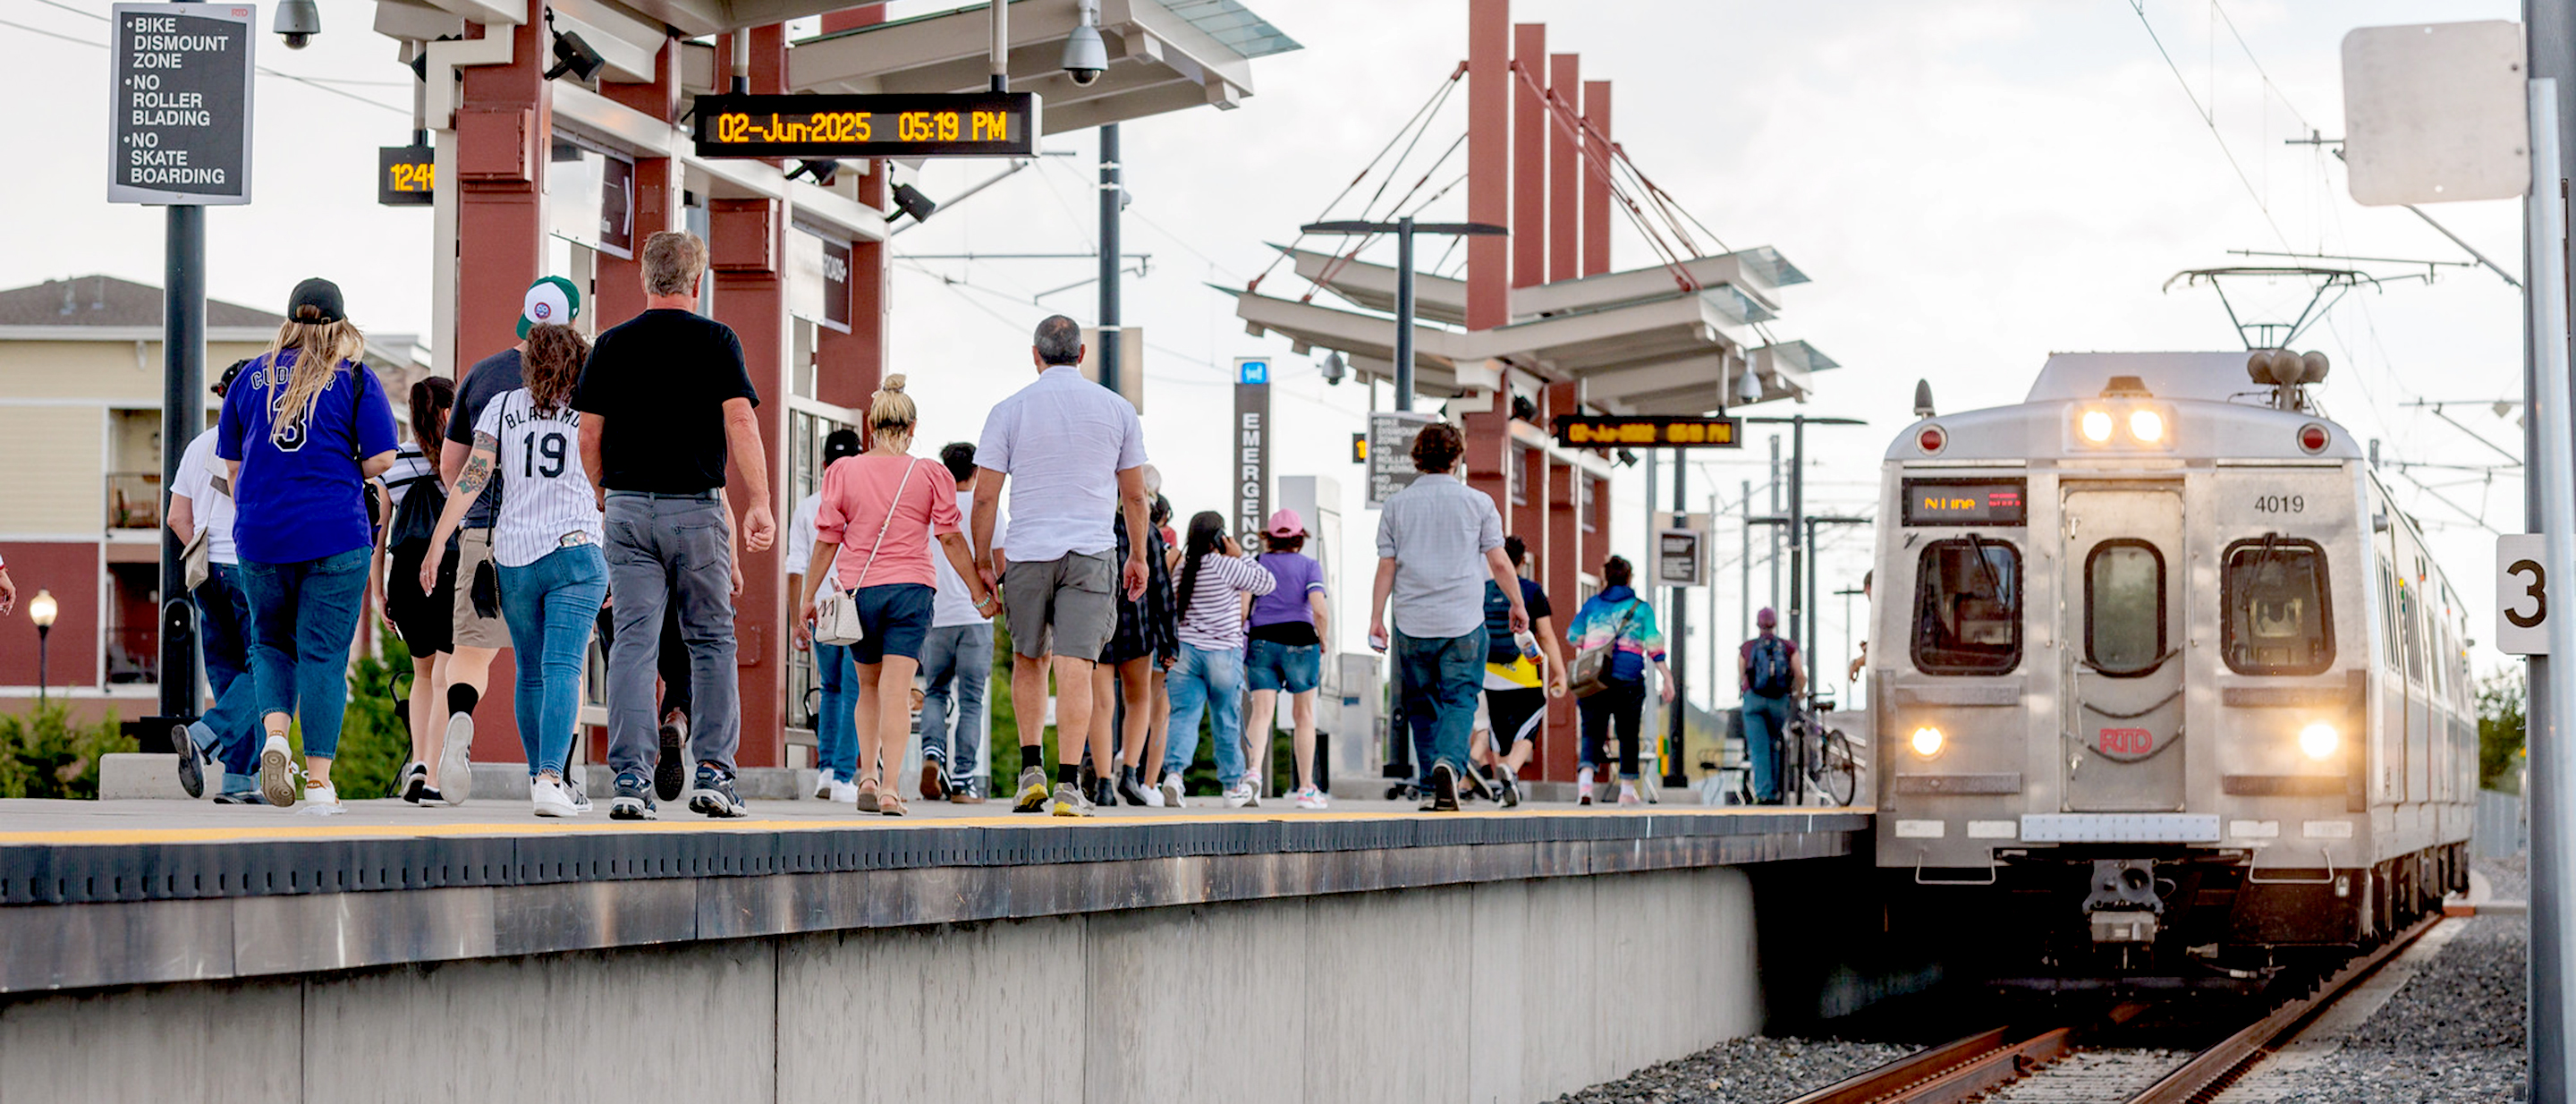
At RTD, connecting with our customers and the communities we serve allows us to better understand needs, expectations, and experiences. One way that we connect with our customers and the community is by conducting annual surveys to gauge agency performance.
The 2025 Customer Excellence Survey and Community Value Survey provide us with insights into what is working well and where additional improvements may be needed. Carefully reviewing this data allows us to identify trends, address concerns, and make informed enhancements to operations and services. This process not only helps RTD to optimize efficiency and customer satisfaction, but it fosters trust and transparency by demonstrating a commitment to listening and continuous improvement. To read more about the survey results, visit RTD's News Stop page.
On this page:

Overview of Surveys
For the fifth year in a row, RTD has surveyed its customers and the community to better understand the agency’s strengths, as well as to identify opportunities for improvement.
RTD once again contracted with ETC Institute, a national, third-party research firm, to conduct its annual surveys in 2025. ETC Institute specializes in community, transportation, public safety, and other types of external surveys for government agencies, non‑profits, and public-service organizations. ETC Institute has conducted more than 3.2 million surveys in 1,000 communities, setting the standard for national benchmark data and metrics.
The research firm’s decades of experience helps local governments and public institutions to better understand public sentiment through expert-designed surveys, robust data analysis, and insightful reporting.
Methodology and Confidence Intervals
Audience, Collection Period, and Survey Method
In April 2025, four separate statistically valid surveys were conducted to better understand perceptions, attitudes, experiences, and opinions of its customers and the community.
| Survey | Audience | Collection Period | Method | Completed Surveys | Confidence Interval |
|---|---|---|---|---|---|
| Community Value | Metro area households, proportionate to demographics | April 2025 | Mail, email, and text | 770 | +/- 3.8% at the 95% confidence level |
| Customer Excellence: Bus | All bus routes, proportionate to spring 2025 boardings | April 2025 | Customer intercept | 1,063 | +/- 2.8% at the 95% confidence level |
| Customer Excellence: Rail | All rail lines, proportionate to spring 2025 boardings | April 2025 | Customer intercept | 758 | +/- 2.8% at the 95% confidence level |
| Customer Excellence: Paratransit | Registered paratransit customers | April 2025 | Mail, email, and text | 444 | +/- 4.9% at the 95% confidence level |
Customer Intercept Method
The bus and rail surveys were conducted using a customer intercept method, which allowed researchers to gather immediate, real-time feedback from individuals using RTD's services. This survey method ensures feedback is provided by actual customers, and the data collected is proportionate to specific bus routes, rail lines, and transit services.
Confidence Intervals
The confidence interval indicates the range within which the true responses of the entire population are likely to fall, based on the survey's data. RTD's surveys are expressed at a 95% confidence level, meaning that if the same exact survey was done 100 times, the results would fall within that range 95 times. This helps ensure the survey results are statistically valid and representative of all customers and the community.
ETC Institute's national comparative transit data is collected from household surveys that are conducted in hundreds of cities nationwide.
Key Takeaways and Highlights
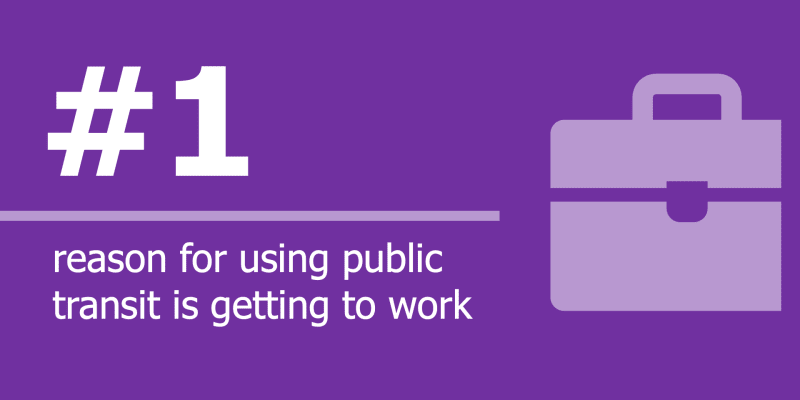 Transit UseGetting to work is the #1 reason people use RTD's bus and rail services, up 7% from 2024
 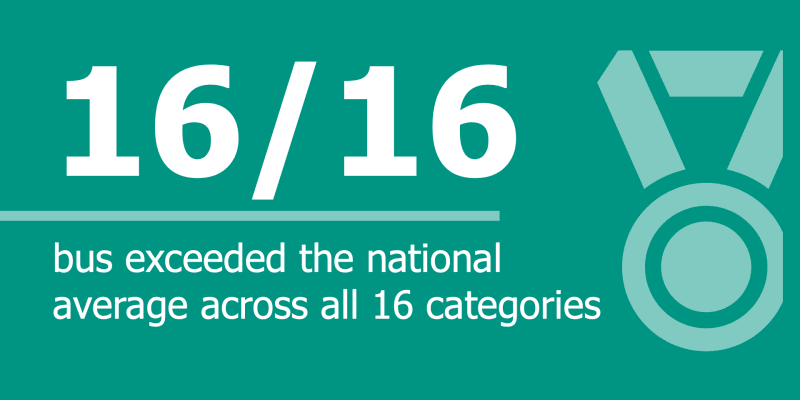 Bus: National AverageBus exceeded the national average across all 16 survey categories
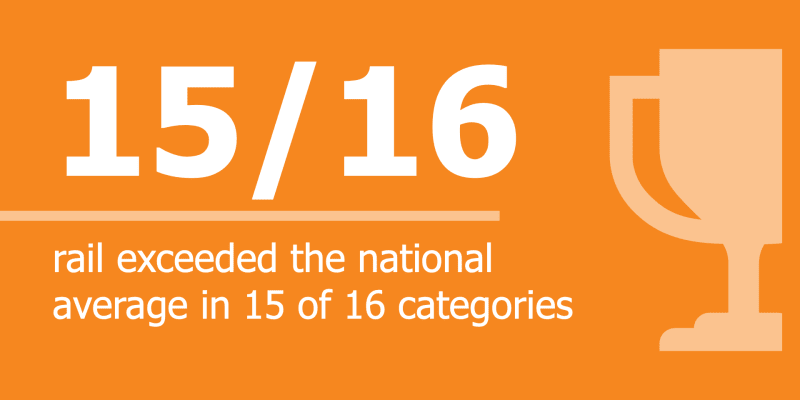 Rail: National AverageRail exceeded the national average in 15 of the 16 survey categories
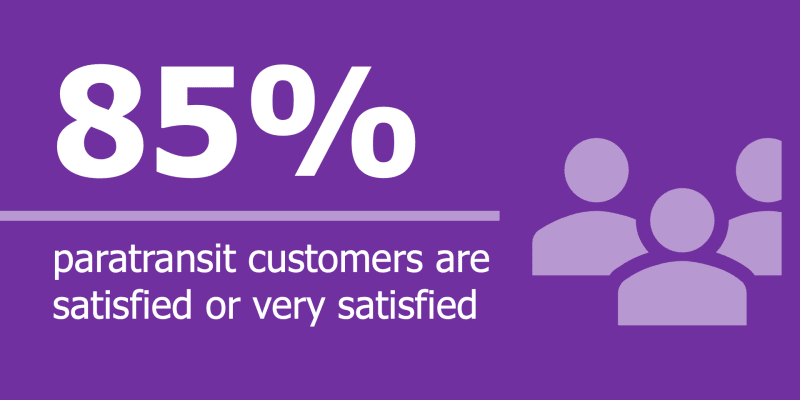 Paratransit: Overall Satisfaction85% of paratransit customers are satisfied or very satisfied with RTD's services
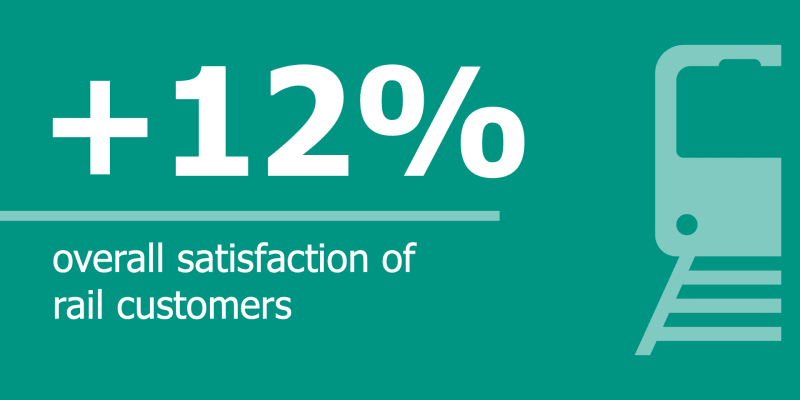 Rail: Overall Satisfaction12% year-over-year increase in the overall satisfaction of rail customers
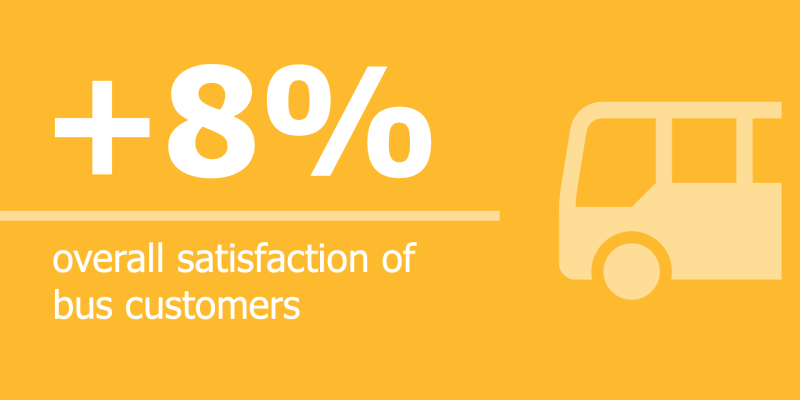 Bus: Overall Satisfaction8% year-over-year increase in the overall satisfaction of bus customers
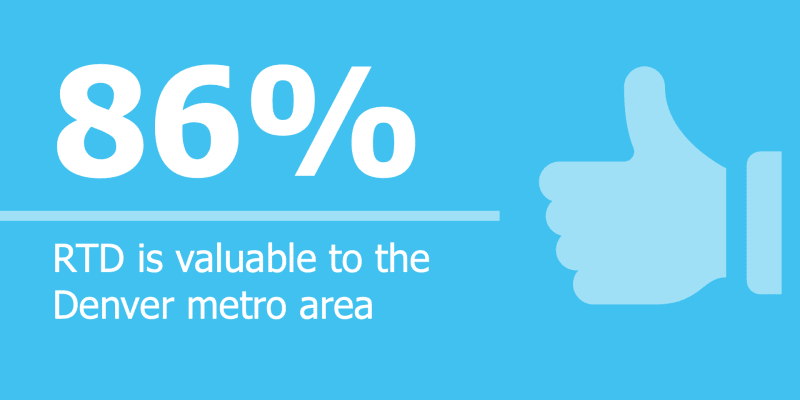 Community: RTD's Value86% of the community believe RTD provides value to the Denver metro area
 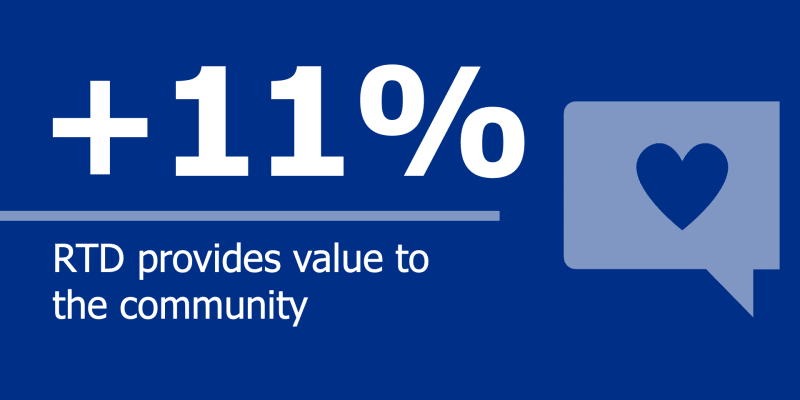 Community: RTD's Value11% year-over-year increase in the community indicating that RTD provides value
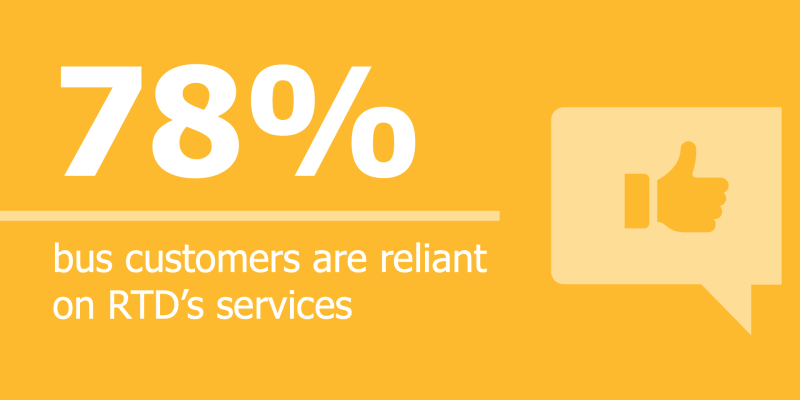 Bus: Customer Characteristic78% of bus customers are reliant on RTD's services
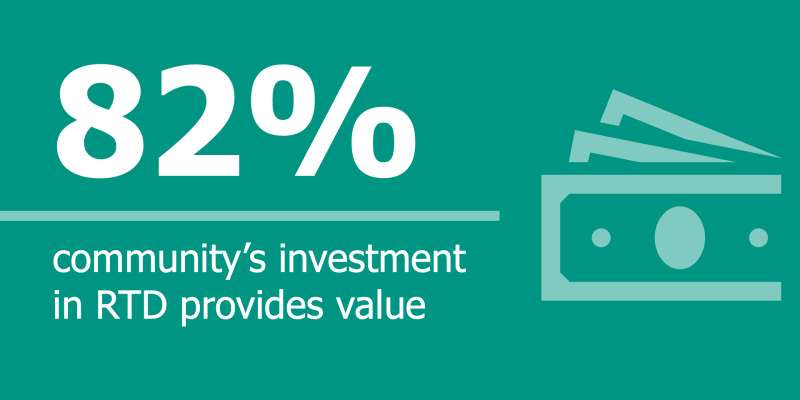 Community: RTD's Value82% of the community believe their investment in RTD provides value
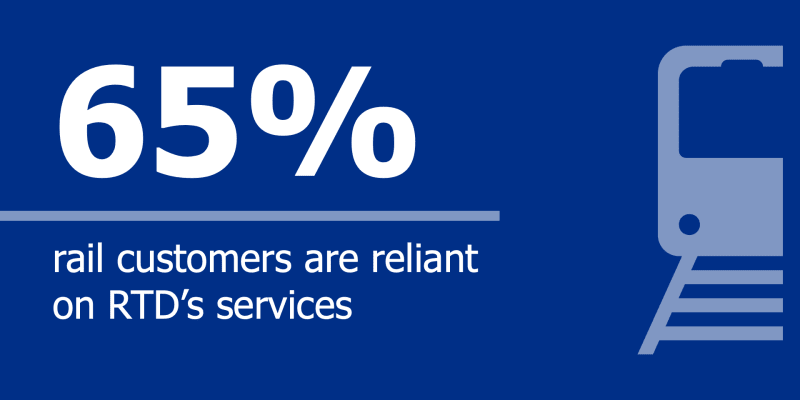 Rail: Customer Characteristic65% of rail customers are reliant on RTD's services
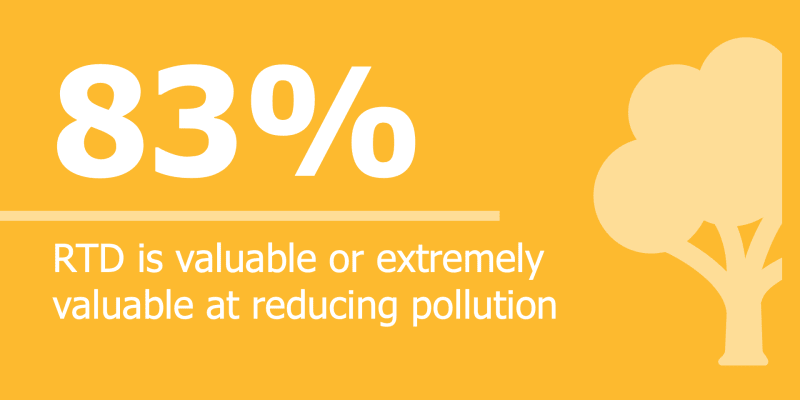 Community: Reducing Pollution83% of the community believe RTD is valuable or extremely valuable at reducing pollution and achieving sustainable practices
| 2025 | 2024 | 2023 | 2025 vs. 2024 Comparison | |
|---|---|---|---|---|
| Work | 41% | 34% | 27% | +7% |
| Leisure, social, or recreation | 35% | 42% | 54% | -7% |
| School | 6% | 4% | 5% | +2% |
| Shopping, groceries, or errands | 9% | 7% | 4% | +2% |
| Medical | 5% | 4% | 2% | +1% |
| Religious activities | 0% | 1% | 1% | -1% |
| Other | 6% | 9% | 7% | -3% |

Customer Excellence Surveys
Three customer-facing surveys were conducted to assess RTD's performance related to Customer Excellence, one of the agency's four adopted Strategic Priorities. Each survey separately focused on bus, rail, and paratransit customers, and the bus and rail surveys were conducted via an on-vehicle intercept method. The sampling plan was inclusive of the entire service area and included all bus routes and rail lines, as well as registered paratransit customers.
Net Promoter Score
NPS Overview
An important metric provided by RTD's customer and community surveys is a Net Promoter Score (NPS). The NPS measures how likely people are to recommend RTD's services to someone else, based on a scale from -100 to +100.
Survey responses are grouped into three categories:
- Promoters (9–10)
- Passives (7–8)
- Detractors (0–6)
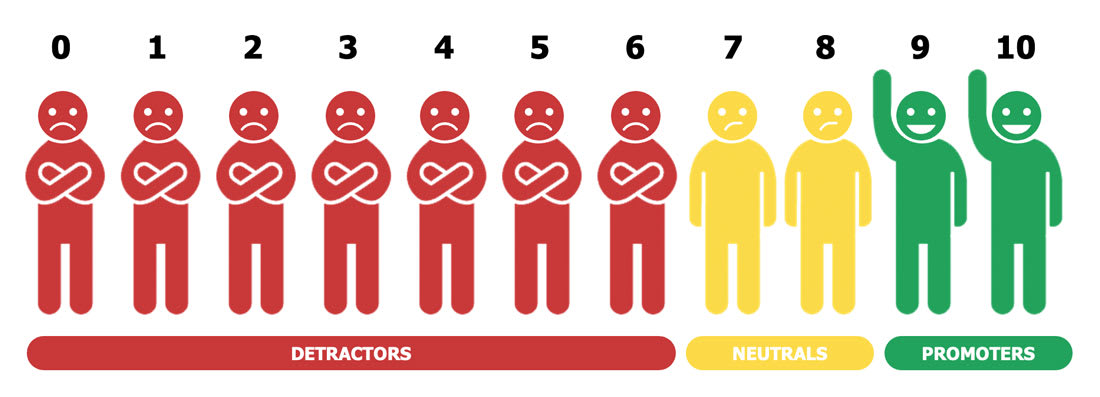
Calculating the NPS
The score is calculated by subtracting the percentage of Detractors from the percentage of Promoters, giving a sense of overall satisfaction, loyalty, and willingness to recommend RTD’s services.

- -100 to 0: Needs Improvement
- 0 to 20: Good
- 21 to 50: Favorable
- 51 to 80: Excellent
- 81 to 100: World Class
Net Promoter Score
Combined Bus, Rail, and Paratransit Customers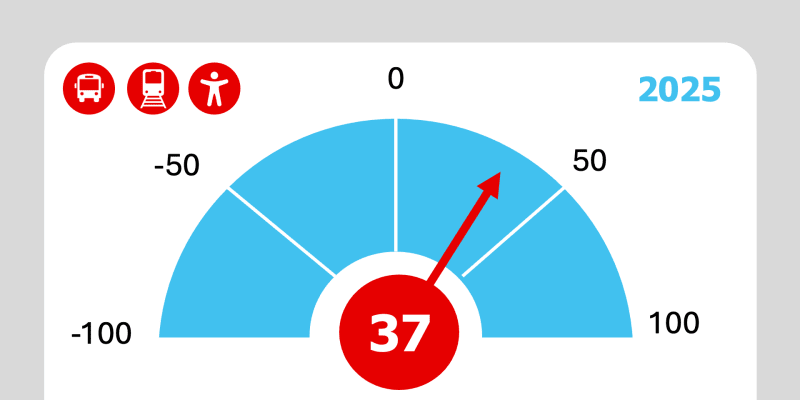 2025Combined NPS Score: +37
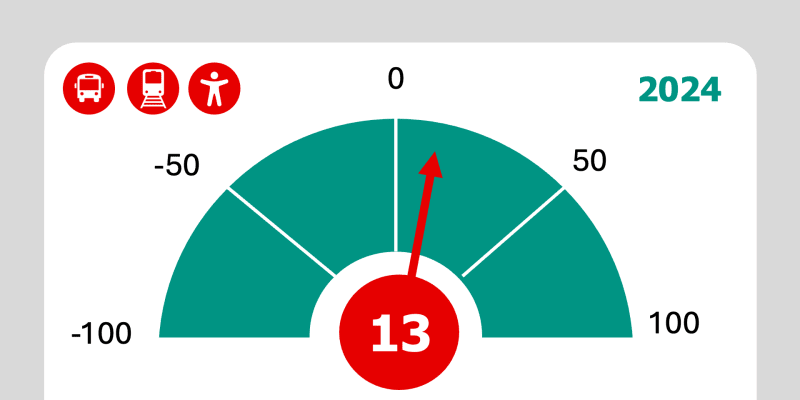 2024Combined NPS Score: +13
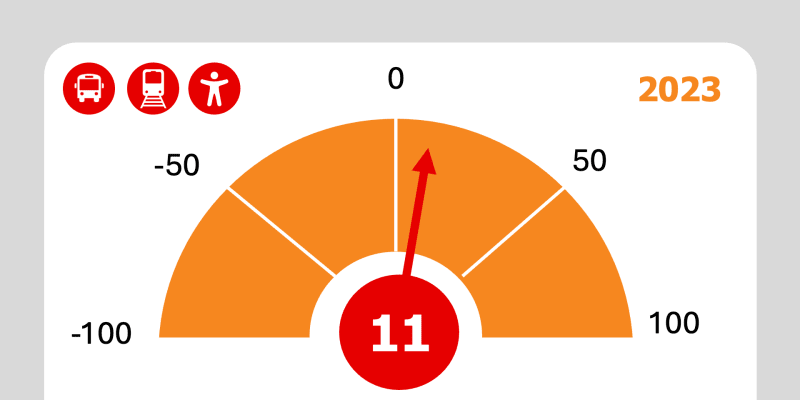 2023Combined NPS Score: +11
Bus: Survey Results
Customer Net Promoter Scores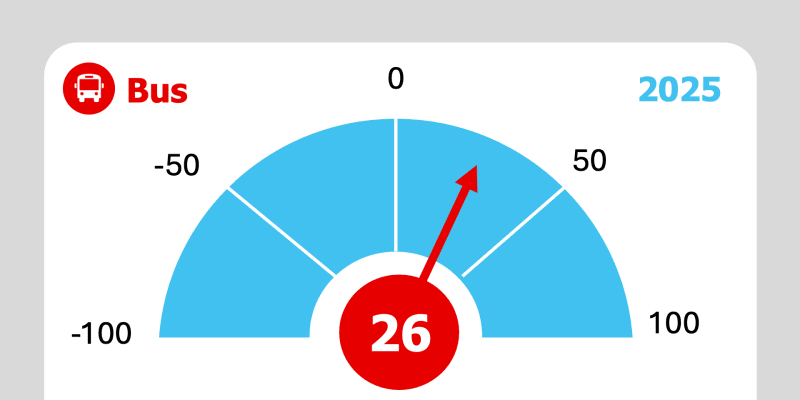 2025Bus NPS Score: +26
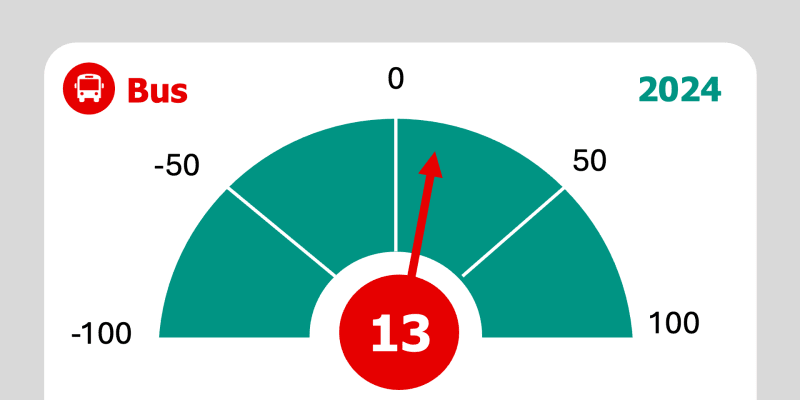 2024Bus NPS Score: +13
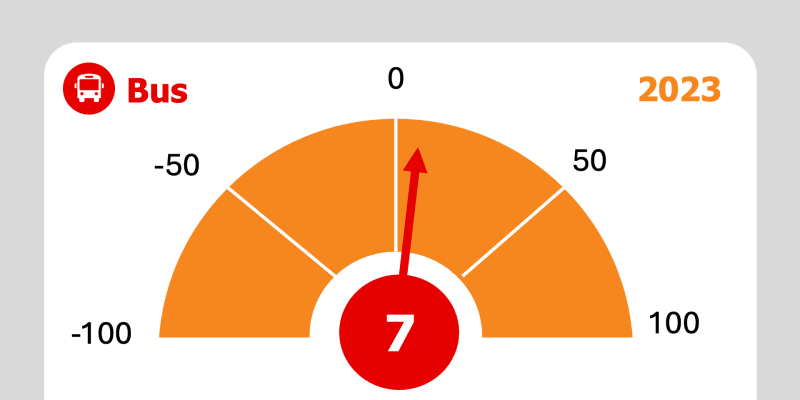 2023Bus NPS Score: +7
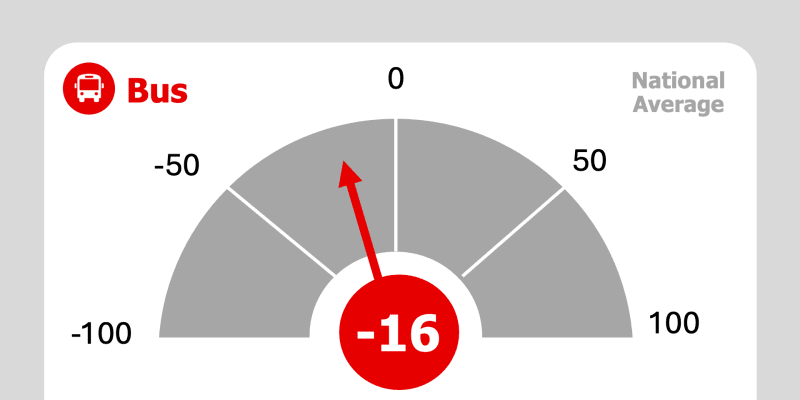 National AverageBus NPS Score: -16
Bus: Key Takeaways and Highlights
Bus: National AverageBus exceeded the national average across all 16 survey categories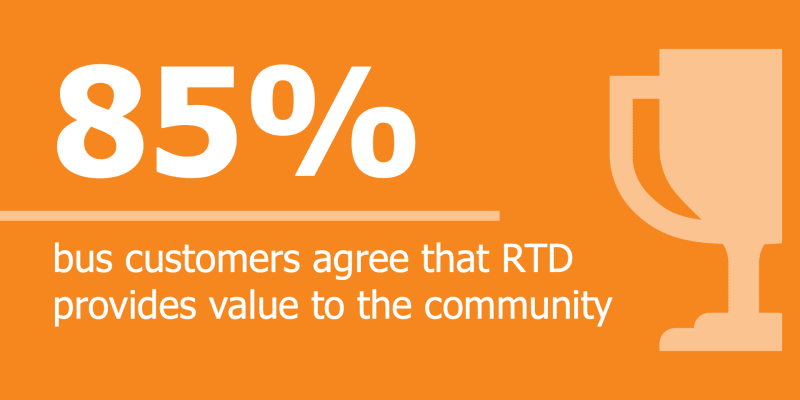 Bus: RTD's Value85% of bus customers agree that RTD provides value to the community
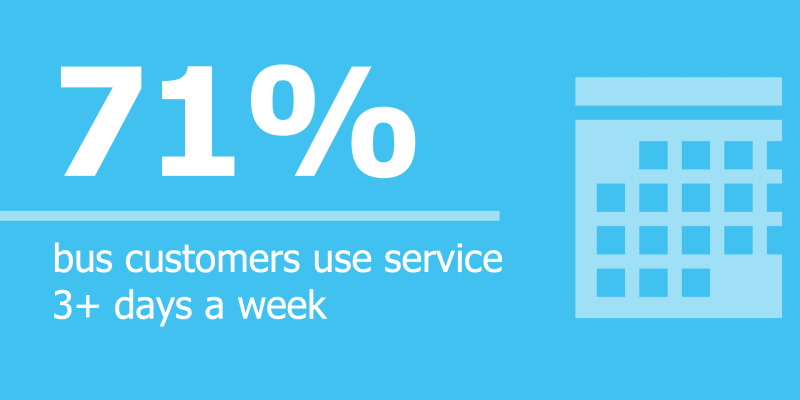 Bus: Customer Characteristic71% of bus customers use RTD's services three or more days a weekBus: Overall Satisfaction8% year-over-year increase in the overall satisfaction of bus customers
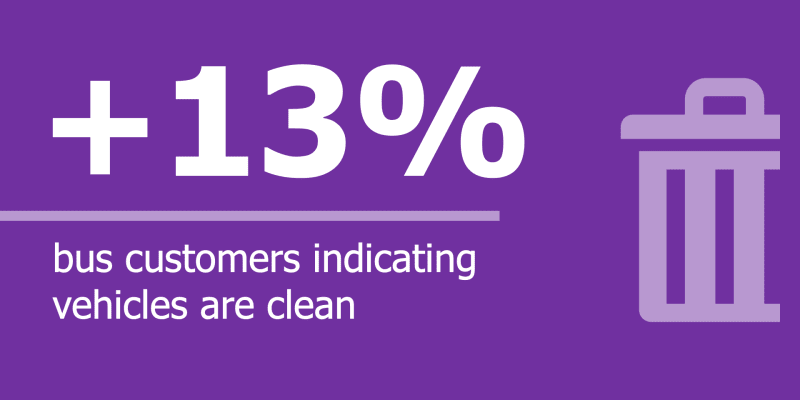 Bus: Cleanliness of Vehicles13% year-over-year increase in bus customers indicating the vehicles are clean
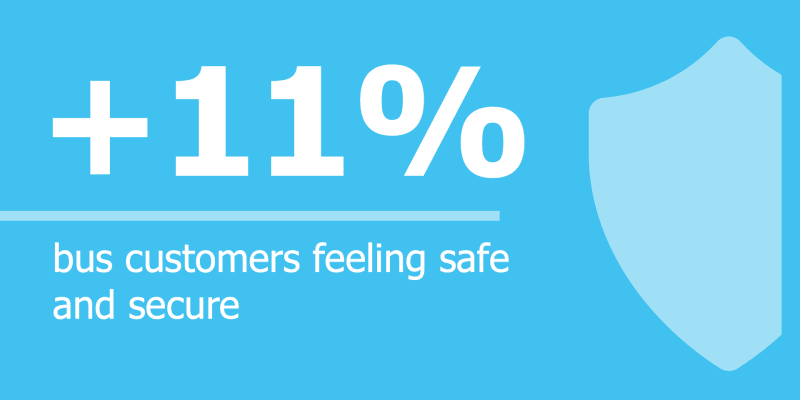 Bus: Safety and Security11% year-over-year increase in bus customers feeling safe and secure while waiting at a stop
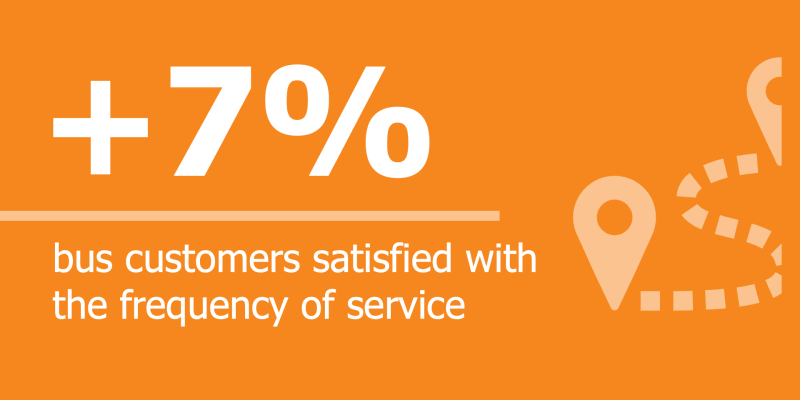 Bus: Frequency of Service7% year-over-year increase in bus customers satisfied or very satisfied with the frequency of service
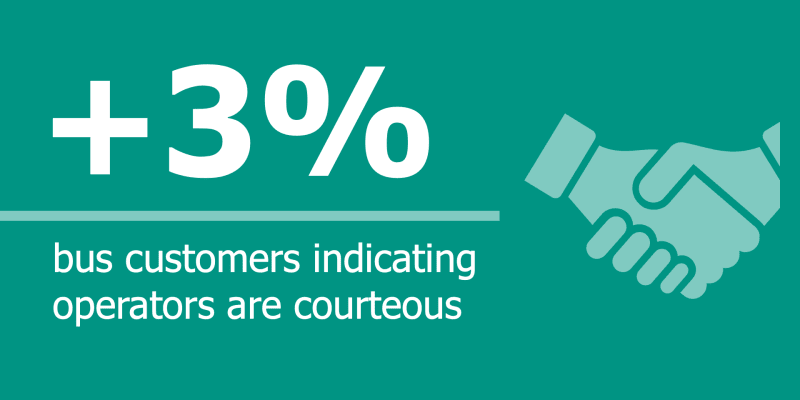 Bus: Operators3% year-over-year increase in customers indicating bus operators are courteousBus: Customer Characteristic78% of bus customers are reliant on RTD's services
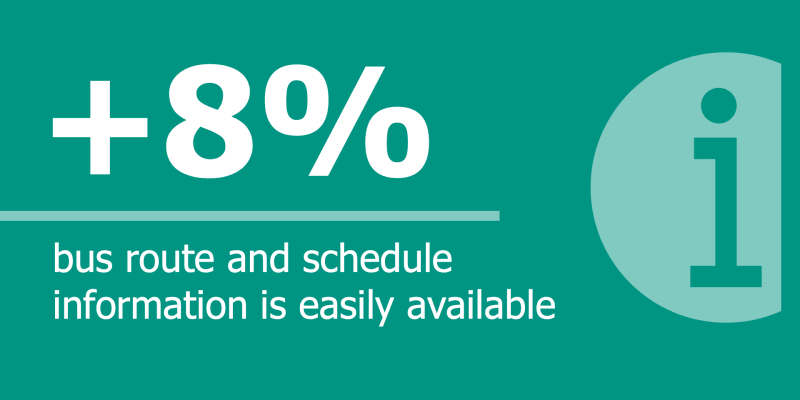 Bus: Information8% year-over-year increase in bus customers indicating that route and schedule information is easily available
Customer Characteristics
Demographics and Transit Use
Bus
- Most likely to be male and 18-39 years old
- 42% White or Caucasian
- 21% Hispanic, Spanish, or Latino/a/x
- 20% Black/African American
- 63% reported household incomes less than $50,000
- 71% use bus service three or more days a week
- 78% are reliant on bus service
- 52% use buses to commute to and from work
Satisfaction and Favorability
Performance
Percentage of survey respondents indicating agreement (Agree or Strongly Agree)
| Question/Topic | 2025 | 2024 | 2023 | National Average | 2025 vs. 2024 Comparison |
|---|---|---|---|---|---|
| The bus usually runs on time | 62.2% | 56.5% | 48.7% | 48% | +5.7% |
| The bus gets me to my destination in a reasonable amount of time | 75.3% | 70.2% | 65.3% | 58% | +5.1% |
| The frequency of service is satisfactory | 68.0% | 61.0% | 59.9% | 54% | +7.0% |
Personal Safety and Comfort
Percentage of survey respondents indicating agreement (Agree or Strongly Agree)
| Question/Topic | 2025 | 2024 | 2023 | National Average | 2025 vs. 2024 Comparison |
|---|---|---|---|---|---|
| I feel safe and secure while waiting for the bus | 65.8% | 54.5% | 56.6% | 35% | +11.3% |
| I feel safe and secure while on the bus | 72.6% | 61.6% | 64.9% | 43% | +11.0% |
| The bus is clean | 67.2% | 53.9% | 61.7% | 38% | +13.3% |
Access
Percentage of survey respondents indicating agreement (Agree or Strongly Agree)
| Question/Topic | 2025 | 2024 | 2023 | National Average | 2025 vs. 2024 Comparison |
|---|---|---|---|---|---|
| The price of fares is reasonable | 76.4% | 71.4% | 63.9% | 60% | 5.0% |
| Bus stops are conveniently located | 75.9% | 74.1% | 66.2% | 54% | +1.8% |
Operations
Percentage of survey respondents indicating agreement (Agree or Strongly Agree)
| Question/Topic | 2025 | 2024 | 2023 | National Average | 2025 vs. 2024 Comparison |
|---|---|---|---|---|---|
| I feel buses are mechanically safe | 88.0% | 84.0% | 79.0% | N/A | +4.0 |
| The buses operate on the days that I need them | 81.4% | 82.9% | 71.5% | N/A | -1.5% |
| The buses operate at the times I need them | 74.1% | 72.0% | 66.4% | N/A | +2.1% |
Information
Percentage of survey respondents indicating agreement (Agree or Strongly Agree)
| Question/Topic | 2025 | 2024 | 2023 | National Average | 2025 vs. 2024 Comparison |
|---|---|---|---|---|---|
| It is easy to find out if buses are running on schedule | 68.1% | 57.4% | 69.2% | 54% | +10.7% |
| If RTD experiences service disruptions, I am adequately informed | 57.4% | 47.7% | 63.8% | 52% | +9.7% |
| I feel RTD has provided adequate information about the services it provides | 82.9% | 72.5% | 80.3% | N/A | 10.4% |
| I feel informed about schedule service changes | 63.0% | 54.6% | 65.8% | N/A | +8.4% |
| Information about route schedules and maps is easily available | 81.1% | 73.1% | 75.2% | N/A | +8.0% |
| Information about route schedules and maps is accurate | 76.7% | 69.8% | 72.4% | N/A | +6.9% |
| Overall, RTD's communications materials and information about services and schedules are of high quality | 75.2% | 64.2% | 75.3% | N/A | +11.0% |
Operator Behavior
Percentage of survey respondents indicating agreement (Agree or Strongly Agree)
| Question/Topic | 2025 | 2024 | 2023 | National Average | 2025 vs. 2024 Comparison |
|---|---|---|---|---|---|
| Bus drivers operate the vehicle safely | 82.8% | 82.5% | 70.8% | 69% | +0.3% |
| Bus drivers are courteous | 77.4% | 74.3% | 70.3% | 61% | +3.1% |
| Bus drivers are helpful | 77.8% | 75.4% | 68.7% | 60% | +2.4% |
Customer Service
Percentage of survey respondents indicating agreement (Agree or Strongly Agree)
| Question/Topic | 2025 | 2024 | 2023 | National Average | 2025 vs. 2024 Comparison |
|---|---|---|---|---|---|
| My question, concern, or complaint was resolved | 63.9% | 56.0% | 60.9% | N/A | +7.9% |
| The resolution was provided in a timely fashion | 90.0% | 91.7% | 89.4% | N/A | -1.7% |
| RTD's customer service representatives are courteous | 74.1% | 71.7% | 62.5% | N/A | +2.4% |
Destinations and Funding
Percentage of survey respondents indicating agreement (Agree or Strongly Agree)
| Question/Topic | 2025 | 2024 | 2023 | National Average | 2025 vs. 2024 Comparison |
|---|---|---|---|---|---|
| RTD provides access to key public service destinations | 83.6% | 80.2% | 74.5% | N/A | +3.4% |
| Private entities, non-profits, and local governments should consider increasing funding to improve the quality and/or expand services | 82.9% | 83.2% | 76.7% | N/A | -0.3% |
Community Value
Percentage of survey respondents indicating agreement (Agree or Strongly Agree)
| Question/Topic | 2025 | 2024 | 2023 | National Average | 2025 vs. 2024 Comparison |
|---|---|---|---|---|---|
| RTD provides value to the community | 84.6% | 84.2% | 72.7% | 67% | +0.4% |
Rail: Survey Results
Customer Net Promoter Scores 2025Rail NPS Score: +31
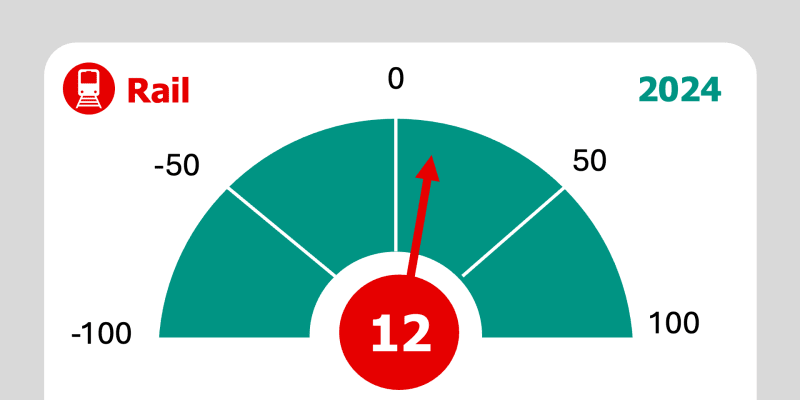 2024Rail NPS Score: +12
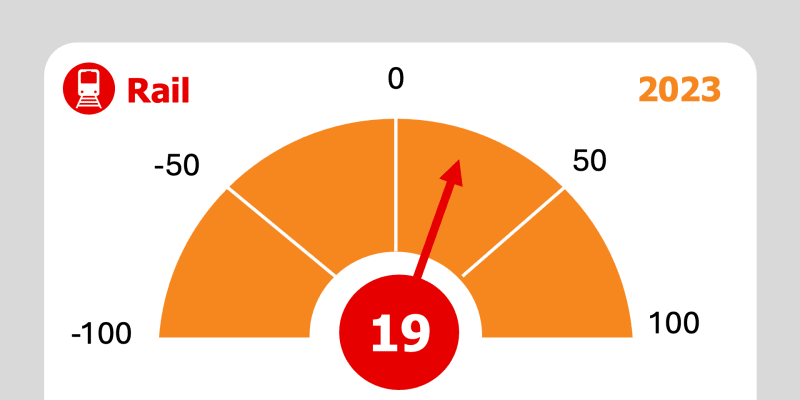 2023Rail NPS Score: +19
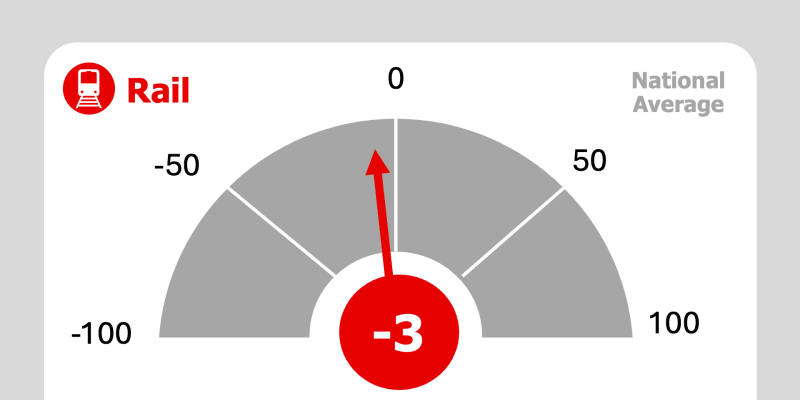 National AverageRail NPS Score: -3
Rail: Key Takeaways and Highlights
Rail: National AverageRail exceeded the national average in 15 of the 16 survey categoriesRail: Customer Characteristic65% of rail customers are reliant on RTD's servicesRail: Overall Satisfaction12% year-over-year increase in the overall satisfaction of rail customers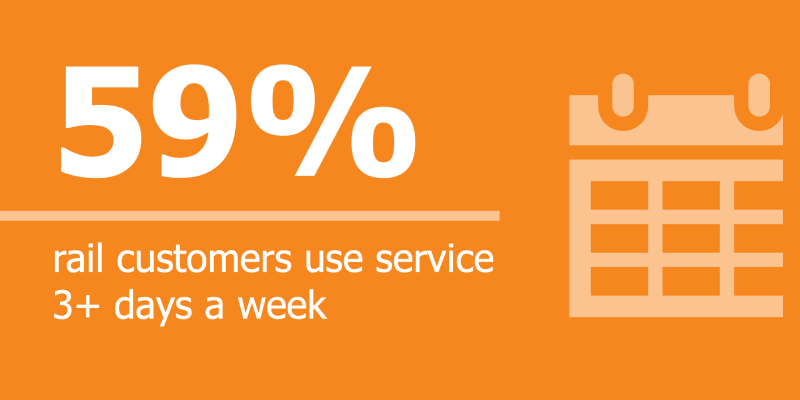 Rail: Customer Characteristic59% of rail customers use RTD's services three or more days a week
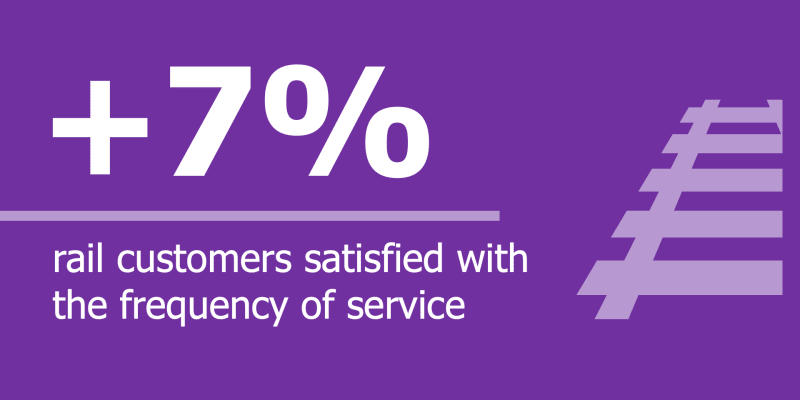 Rail: Frequency of Service7% year-over-year increase in rail customers satisfied or very satisfied with the frequency of service
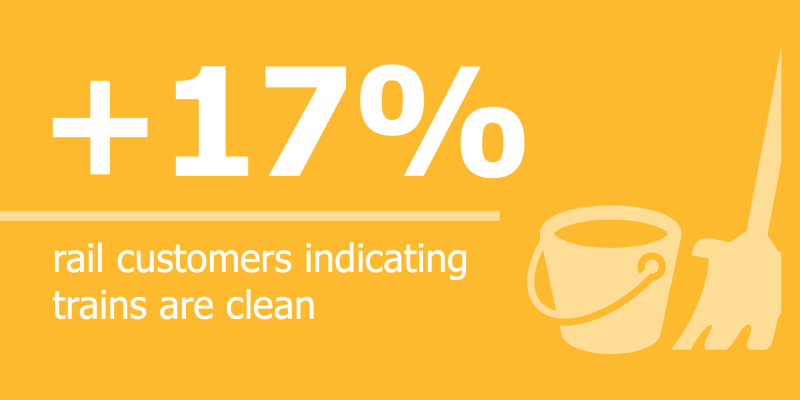 Rail: Cleanliness of Vehicles17% year-over-year increase in rail customers indicating the trains are clean
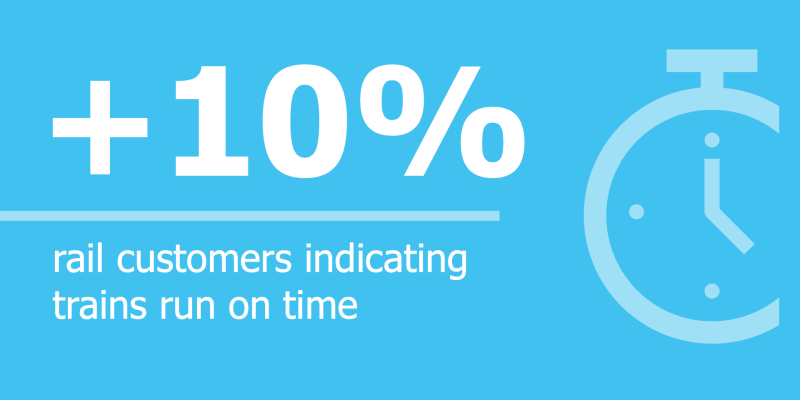 Rail: On-Time Performance10% year-over-year increase in rail customers indicating the trains run on time
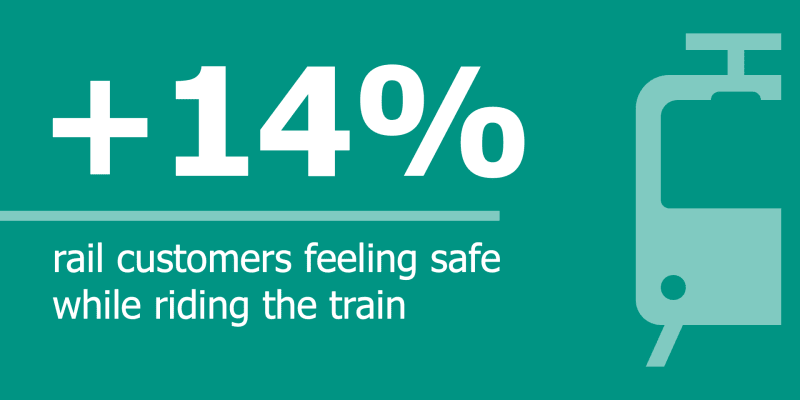 Rail: Safety and Security14% year-over-year increase in rail customers feeling safe while riding the train
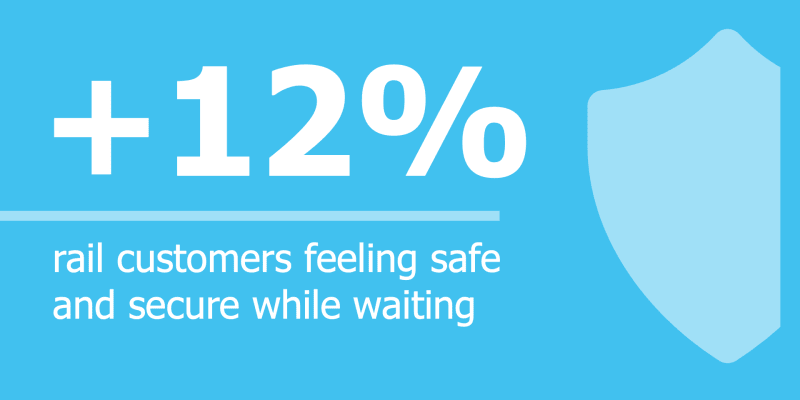 Rail: Safety and Security12% year-over-year increase in rail customers feeling safe and secure while waiting at a station
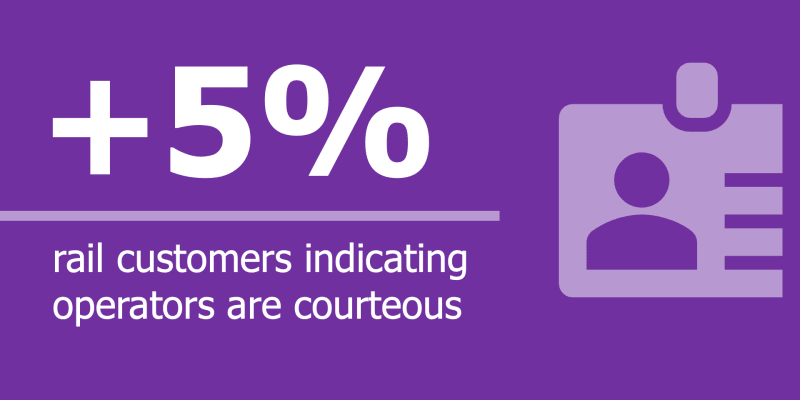 Rail: Operators5% year-over-year increase in customers indicating rail operators are courteous
Customer Characteristics
Demographics and Transit Use
Rail
- Most likely to be male and 18-39 years old
- 50% White or Caucasian
- 17% Hispanic, Spanish, or Latino/a/x
- 12% Black/African American
- 40% reported household incomes less than $50,000
- 59% use rail three or more days a week
- 65% are reliant on rail services
- 48% uses trains to commute to and from work
Satisfaction and Favorability
Performance
Percentage of survey respondents indicating agreement (Agree or Strongly Agree)
| Question/Topic | 2025 | 2024 | 2023 | National Average | 2025 vs. 2024 Comparison |
|---|---|---|---|---|---|
| The train usually runs on time | 62.7% | 53.1% | 53.2% | 53% | +9.6% |
| The train gets me to my destination in a reasonable amount of time | 78.4% | 71.5% | 62.2% | 71% | +6.9% |
| The frequency of service is satisfactory | 69.7% | 62.6% | 61.5% | 57% | +7.1% |
Personal Safety and Comfort
Percentage of survey respondents indicating agreement (Agree or Strongly Agree)
| Question/Topic | 2025 | 2024 | 2023 | National Average | 2025 vs. 2024 Comparison |
|---|---|---|---|---|---|
| I feel safe and secure while waiting for the train | 67.2% | 55.6% | 57.7% | 34% | +11.6% |
| I feel safe and secure while on the train | 75.5% | 61.7% | 62.6% | 46% | +13.8% |
| The train is clean | 70.8% | 54.2% | 62.0% | 39% | +16.6% |
Access
Percentage of survey respondents indicating agreement (Agree or Strongly Agree)
| Question/Topic | 2025 | 2024 | 2023 | National Average | 2025 vs. 2024 Comparison |
|---|---|---|---|---|---|
| The price of fares is reasonable | 77.5% | 76.1% | 63.1% | 60% | +1.4% |
| Rail stations/lines are conveniently located | 83.3% | 79.0% | 69.6% | 59% | +4.3% |
Operations
Percentage of survey respondents indicating agreement (Agree or Strongly Agree)
| Question/Topic | 2025 | 2024 | 2023 | National Average | 2025 vs. 2024 Comparison |
|---|---|---|---|---|---|
| I feel that the trains are mechanically safe | 89.4% | 88.0% | 80.0% | N/A | +1.4% |
| The trains operate on the days that I need them | 86.5% | 86.1% | 76.8% | N/A | +0.4% |
| The trains operate at the times I need them | 77.5% | 70.8% | 66.5% | N/A | +6.7% |
Information
Percentage of survey respondents indicating agreement (Agree or Strongly Agree)
| Question/Topic | 2025 | 2024 | 2023 | National Average | 2025 vs. 2024 Comparison |
|---|---|---|---|---|---|
| It is easy to find out if trains are running on schedule | 66.0% | 59.9% | 61.9% | 56% | +6.1% |
| If RTD experiences service disruptions, I am adequately informed | 55.6% | 50.9% | 56.1% | 60% | +4.7% |
| I feel RTD has provided adequate information about the services it provides | 83.8% | 74.4% | 79.9% | N/A | +9.5% |
| I feel informed about schedule service changes | 62.5% | 54.8% | 59.7% | N/A | +7.8% |
| Information about route schedules and maps is easily available | 79.6% | 77.9% | 73.8% | N/A | +1.7% |
| Information about route schedules and maps is accurate | 78.6% | 72.1% | 71.0% | N/A | +6.5% |
| Overall, RTD's communications materials and information about services and schedules are of high quality | 73.7% | 67.1% | 70.2% | N/A | +6.6% |
Operator Behavior
Percentage of survey respondents indicating agreement (Agree or Strongly Agree)
| Question/Topic | 2025 | 2024 | 2023 | National Average | 2025 vs. 2024 Comparison |
|---|---|---|---|---|---|
| Train drivers operate the vehicle safely | 86.2% | 85.1% | 78.1% | 72% | +1.1% |
| Train drivers are courteous | 84.9% | 80.4% | 73.2% | 57% | +4.5% |
| Train drivers are helpful | 82.1% | 77.3% | 73.2% | 61% | +4.8% |
Customer Service
Percentage of survey respondents indicating agreement (Agree or Strongly Agree)
| Question/Topic | 2025 | 2024 | 2023 | National Average | 2025 vs. 2024 Comparison |
|---|---|---|---|---|---|
| My question, concern, or complaint was resolved | 61.6% | 56.9% | 58.6% | N/A | +4.8% |
| The resolution was provided in a timely fashion | 84.1% | 93.2% | 92.7% | N/A | -9.1% |
| RTD's customer service representatives are courteous | 68.4% | 69.6% | 66.0% | N/A | -1.2% |
Destinations and Funding
Percentage of survey respondents indicating agreement (Agree or Strongly Agree)
| Question/Topic | 2025 | 2024 | 2023 | National Average | 2025 vs. 2024 Comparison |
|---|---|---|---|---|---|
| RTD provides access to key public service destinations | 85.5% | 84.3% | 75.8% | N/A | +1.2% |
| Private entities, non-profits, and local governments should consider increasing funding to improve the quality and/or expand services | 84.4% | 88.6% | 75.8% | N/A | -4.3% |
Community Value
Percentage of survey respondents indicating agreement (Agree or Strongly Agree)
| Question/Topic | 2025 | 2024 | 2023 | National Average | 2025 vs. 2024 Comparison |
|---|---|---|---|---|---|
| RTD provides value to the community | 86.6% | 85.0% | 79.0% | 73% | +1.6% |
Paratransit: Survey Results
Customer Net Promoter Scores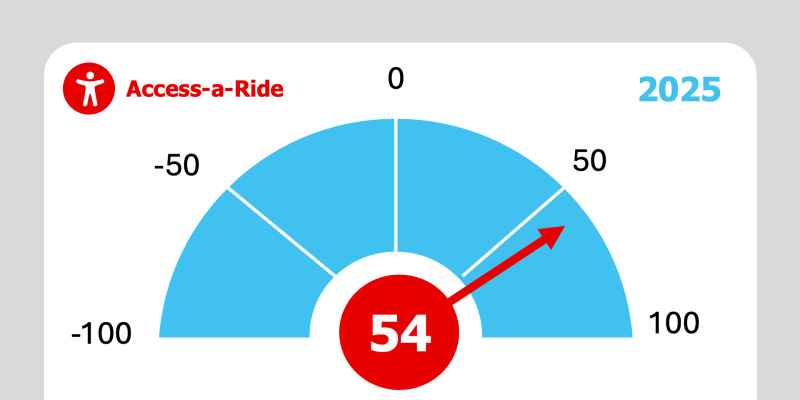 2025Access-a-Ride NPS Score: +54
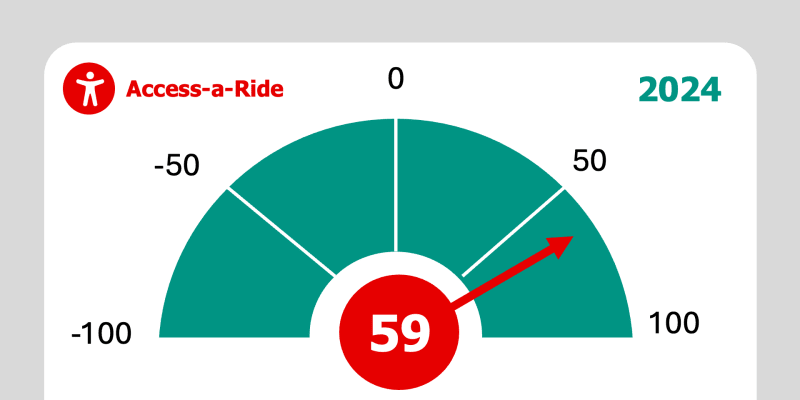 2024Access-a-Ride NPS Score: +59
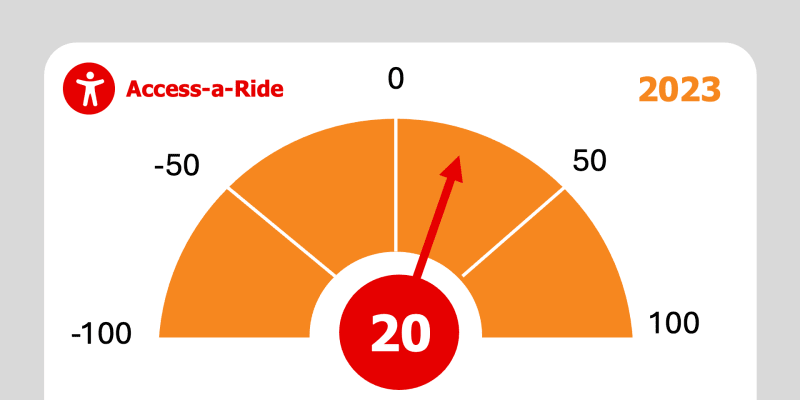 2023Access-a-Ride NPS Score: +20
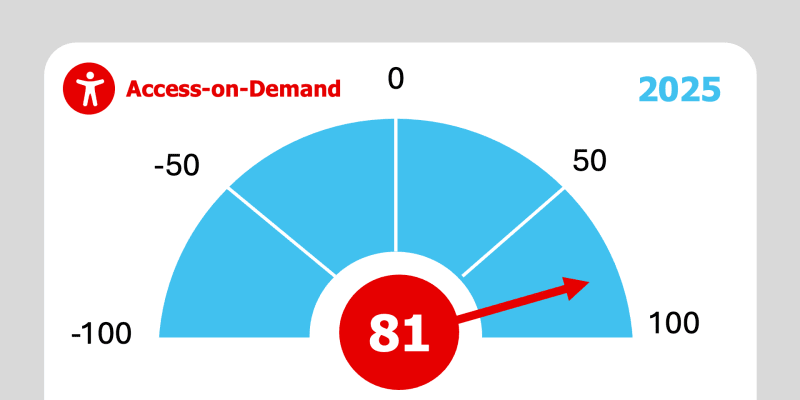 2025Access-on-Demand NPS Score: +81
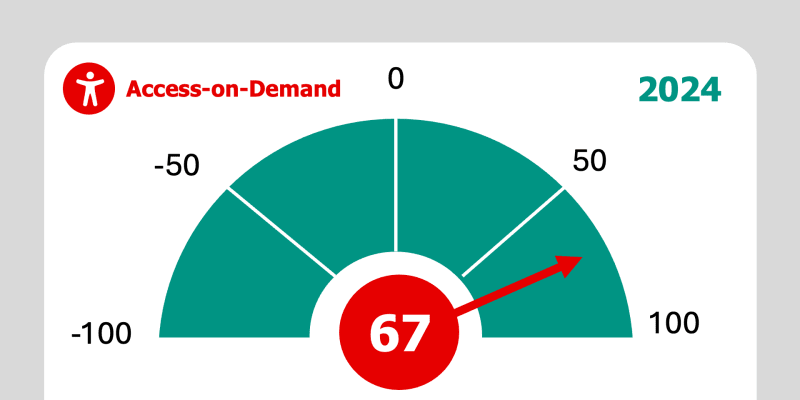 2024Access-on-Demand NPS Score: +67
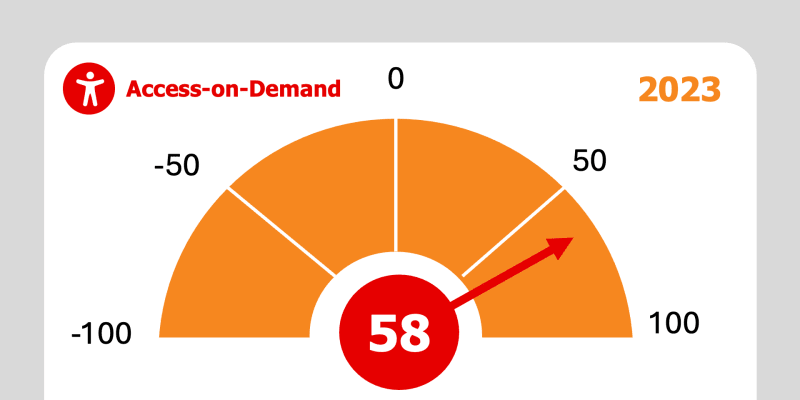 2023Access-on-Demand NPS Score: +58
Customer Characteristics
Demographics and Transit Use
Paratransit
- Most likely to be female and over 65 years old
- AaR:64% AoD:66% White or Caucasian
- AaR:16% AoD:12% Hispanic, Spanish, or Latino/a/x
- AaR:18% AoD:15% Black/African American
- AaR:86% AoD:90% reported household incomes less than $50,000
- AaR: 52% of users surveyed use AaR for most of their trips
- AaR: 41% use services for medical appointments
- AoD: 74% of users surveyed use AoD for making most of their trips
- AoD: 45% use services for medical appointments
AaR: Access-a-Ride
AoD: Access-on-Demand
Satisfaction and Favorability
Overall Satisfaction
Percentage of survey respondents indicating satisfaction (Satisfied or Very Satisfied)
| Question/Topic | 2025 | 2024 | 2023 | National Average | 2025 vs. 2024 Comparison |
|---|---|---|---|---|---|
| Access-a-Ride | 84% | 80% | N/A | +4% | |
| Access-on-Demand | 97% | 86% | +11% |

Community Value Survey
In addition to gathering feedback directly from customers, RTD also solicited separate feedback from households across the Denver metro area.
Community: Survey Results
Community Net Promoter Scores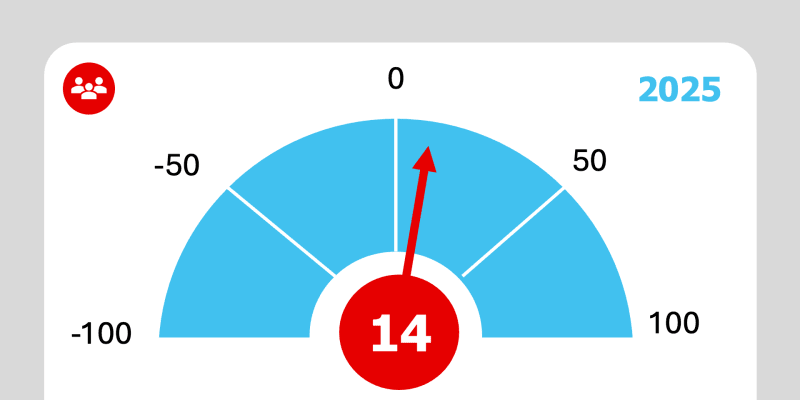 2025Community NPS Score: +14
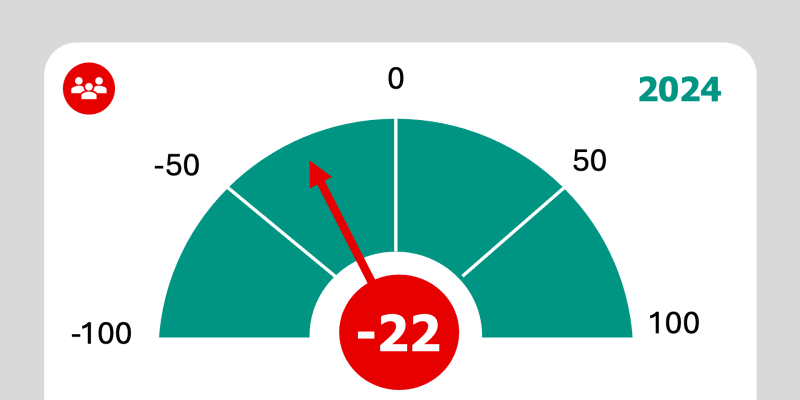 2024Community NPS Score: -22
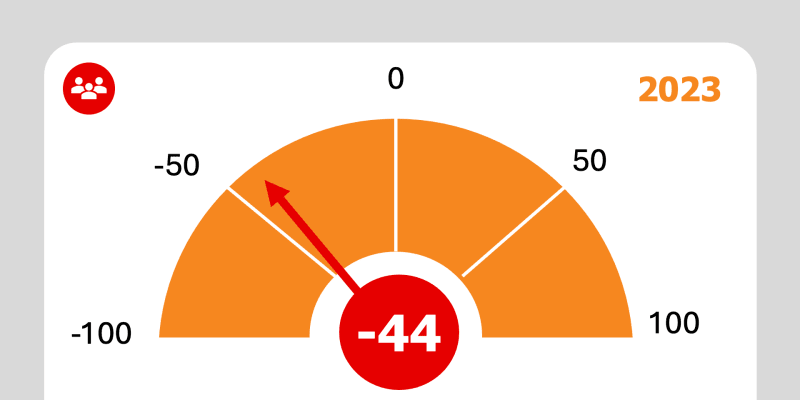 2023Community NPS Score: -44
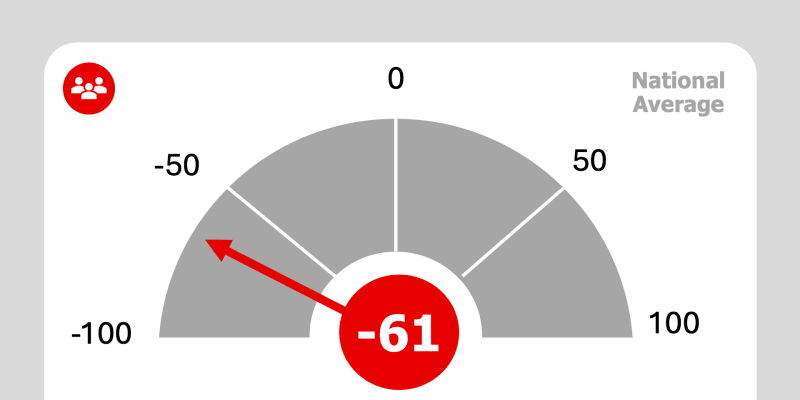 National AverageCommunity NPS Score: -61
RTD's Value
Perception of Value
Percentage of survey respondents indicating Valuable or Extremely Valuable
| Question/Topic | 2025 | 2024 | 2023 | National Average | 2025 vs. 2024 Comparison |
|---|---|---|---|---|---|
| Value to the greater Denver region | 86% | 86% | 84% | 66% | +0% |
| Value to you personally | 73% | 62% | 54% | 31% | +11% |
| Providing transportation options to people with special mobility needs | 88% | 88% | 82% | 78% | +0% |
| Providing affordable transportation options | 82% | 80% | 78% | 77% | +2% |
| Improving quality of life | 76% | 75% | 66% | 56% | +1% |
| Attracting and retaining more employment opportunities in the region | 64% | 65% | 62% | 54% | -1% |
| Reducing traffic congestion | 80% | 78% | 75% | 56% | +2% |
| Making roads safer for all users | 74% | 73% | 68% | 45% | +1% |
| Providing access to places of employment | 77% | 73% | 68% | 69% | +4% |
| Providing access to medical facilities | 69% | 69% | 62% | 77% | +0% |
| Providing access to educational facilities | 78% | 81% | 75% | 72% | -3% |
| Providing access to places of leisure | 76% | 77% | 73% | 57% | -1% |
| Achieving sustainable practices, reducing pollution and carbon footprint | 83% | 83% | 82% | 58% | +0% |
| Providing safe transportation alternative | 81% | 77% | 73% | 74% | +4% |
| Providing access to the region, adjacent cities and counties | 69% | 71% | 61% | 69% | -2% |
| Supporting community business | 68% | 72% | 64% | N/A | -4% |
| Providing opportunities to locate affordable housing | 63% | 63% | 53% | N/A | +0% |
Service-Related Favorability
Perception of Favorability
Percentage of survey respondents indicating agreement (Agree or Strongly Agree)
| Question/Topic | 2025 | 2024 | 2023 | National Average | 2025 vs. 2024 Comparison |
|---|---|---|---|---|---|
| I have a positive perception of the RTD brand | 48% | 46% | 44% | 45% | +2% |
| I feel personally secure while using RTD services | 46% | 43% | 40% | 55% | +3% |
| RTD adequately serves employment centers | 44% | 36% | 36% | 32% | +8% |
| RTD's financial reporting is understandable and transparent | 27% | 25% | 20% | 22% | +2% |
| I feel that RTD vehicles are mechanically safe | 90% | 85% | 88% | 55% | +5% |
| RTD services are accessible to people with various disabilities | 76% | 72% | 74% | 42% | +4% |
| RTD is a diverse, equitable, and inclusive community resource | 71% | 63% | 61% | N/A | +8% |
| RTD service supports community business | 52% | 48% | 45% | N/A | +4% |
| The community's investment in transit provides value | 82% | 81% | 80% | N/A | +1% |
| RTD is trustworthy | 44% | 40% | 37% | 55% | +4% |
| RTD is a good steward of public funds | 33% | 29% | 27% | N/A | +4% |
| RTD manages its financial resources well | 21% | 19% | 14% | N/A | +2% |